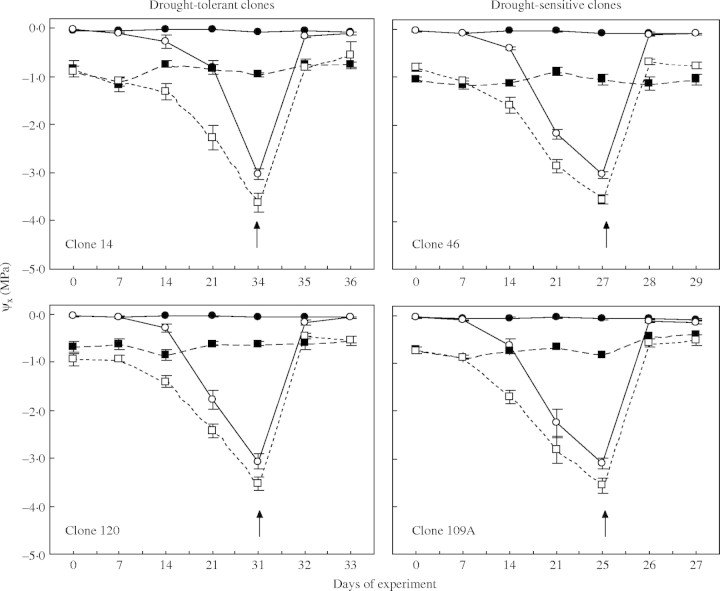
Fig. 2.
Time-course of leaf xylem pressure potential (ψx), both pre-dawn (circles) and at midday (squares), of four clones of robusta coffee either fully irrigated (solid lines) or droughted (dotted lines). Arrows indicate when predawn ψx reached −3·0 MPa, when the drought-stressed plants were re-watered (at 1800 h); measurements were then made for a further 2 d. Note differences in scale on horizontal axes. Each point represents the mean ± s.e. of five replicates.

