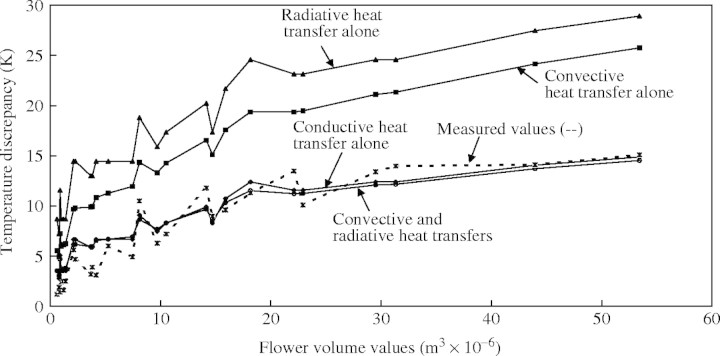
Fig. 4.
Relationships between the volume of the thermogenic zone and the maximum temperature difference between the inflorescence and the ambient air for all the species studied. Measured temperatures (dashed line) are shown together with calculated temperatures (solid lines) according to the four different heat transfer models (see text for full explanation).

