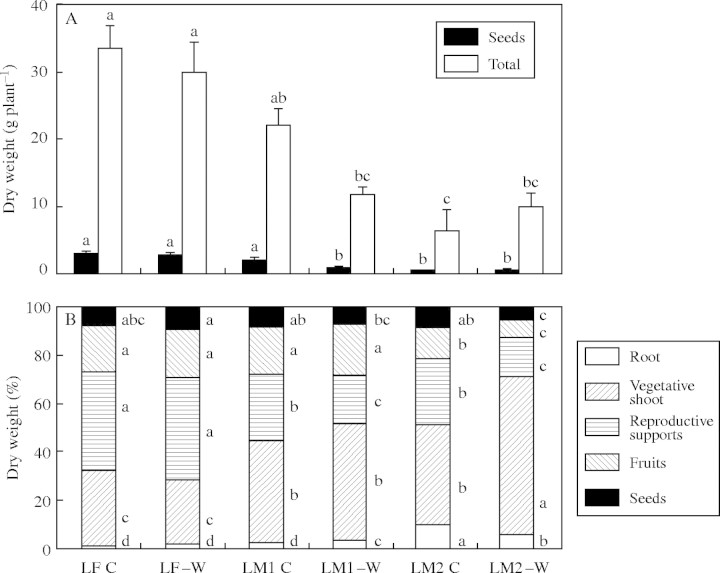
Fig. 3.
Total and seed biomass (A) and allocation to the different fractions (B) for L. fendleri (LF) and L. mendocina plants harvested after its first (LM1) and second (LM2) flowering cycle, for control (C) and water-stressed (−W) treatments. In LM2 plant allocations and biomass are only for those produced during the second season. Different letters indicate significant differences between treatments for each fraction (P < 0·05). n = 33–40.

