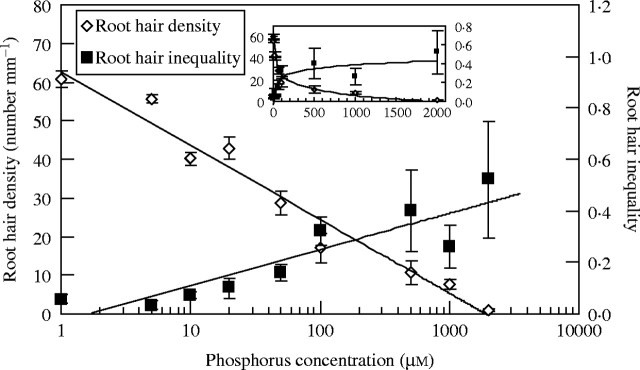
Fig. 2.

The mean and the inequality of root hair density under different phosphorus concentrations in A. thaliana (mean values of root hair density from Ma et al., 2001a). For line of inequality: G = 0·0607ln(concentration) − 0·0316, R2 = 0·8004. The inset is on a non-logarithmic scale showing that change of inequality is greatest at low phosphorus range. The inequality of root hair density decreased logarithmically with decrease in phosphorus concentration. Error bars indicate standard errors (for G, derived from jacknife method on pooled data of all individual roots from all experiments; for means, derived from three experiments).
