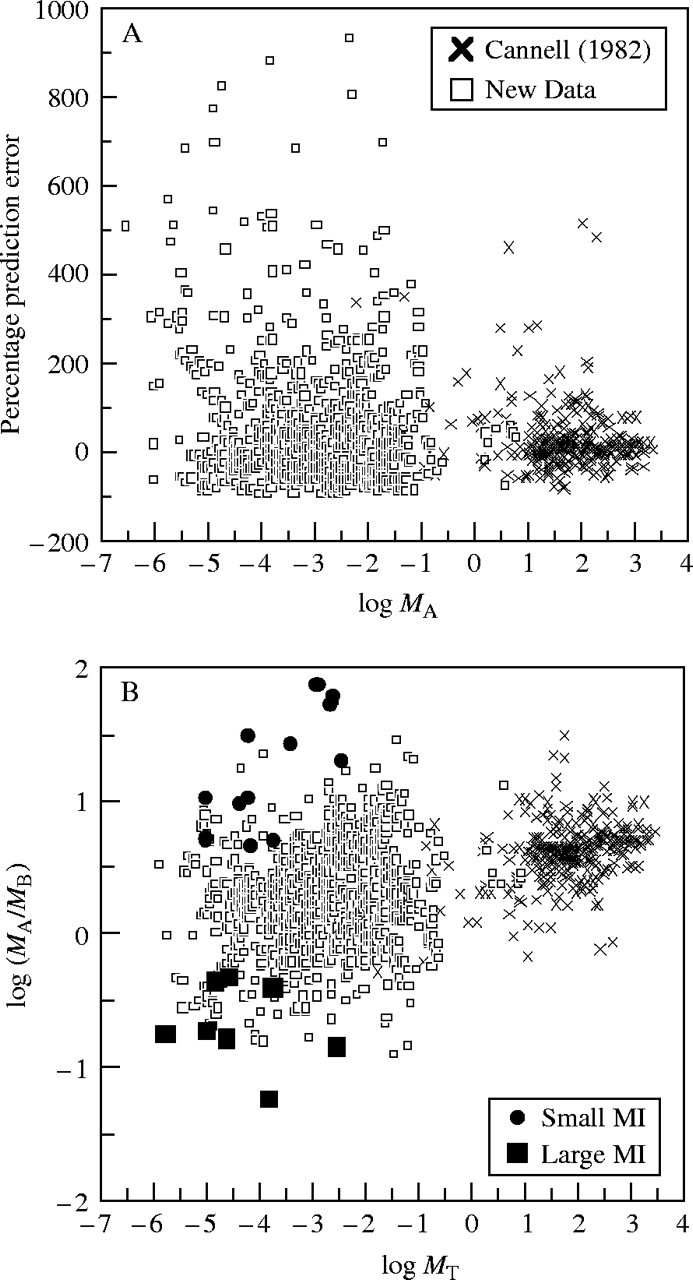
Fig. 2.

Bivariant plots of regression curve percentage prediction error and above- and below-ground quotients (MA/MB). (A) Percentage prediction error of the two ordinary least squares regression curves for below- versus above-ground biomass for the Cannell (1982) and new data sets plotted against log-transformed data for above-ground biomass. (B) Log of above- and below-ground biomass quotients plotted against log of total body mass (MT = MA + MB). Data for plants developing from seeds with either large or small material investments (endosperm or cotyledons) are indicated for a limited number of reports.
