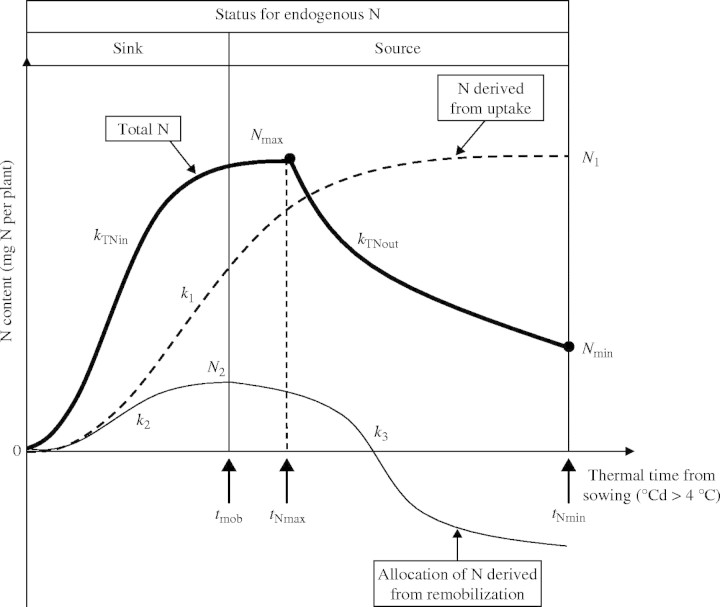
Fig. 1.
N dynamics in each organ during source/sink transition in terms of parameters characterizing N allocation and N mobilization. tNmax and tNmin, time when organ reaches Nmax and Nmin, respectively (°Cd); Nmax and Nmin, highest and lowest total N content value (mg plant−1); kTNin and kTNout, slope of equations characterizing N allocation and N mobilization (°Cd−1); k1, k2 and k3, slope of equations characterizing 15N allocation, endogenous N allocation and mobilization, respectively; N1, highest N content derived from N uptake; N2, highest N content derived from mobilization; tmob, time when endogenous N mobilization starts.

