
Fig. 4.
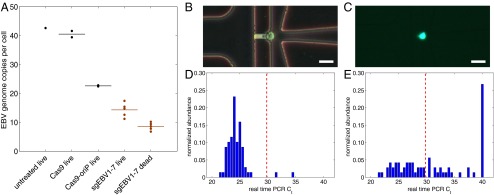
EBV load quantitation after CRISPR treatment. (A) EBV load after different CRISPR treatments by digital PCR. Cas9 and Cas9-oriP had two replicates, and sgEBV1–7 had five replicates. (B and C) Microscopy of captured single cells for whole-genome amplification. (D) Histogram of EBV quantitative PCR Ct values from single cells before treatment. (E) Histogram of EBV quantitative PCR Ct values from single live cells 7 d after sgEBV1–7 treatment. Red dash lines in D and E represent Ct values of one EBV genome per cell. (Scale bars: 25 μm.)