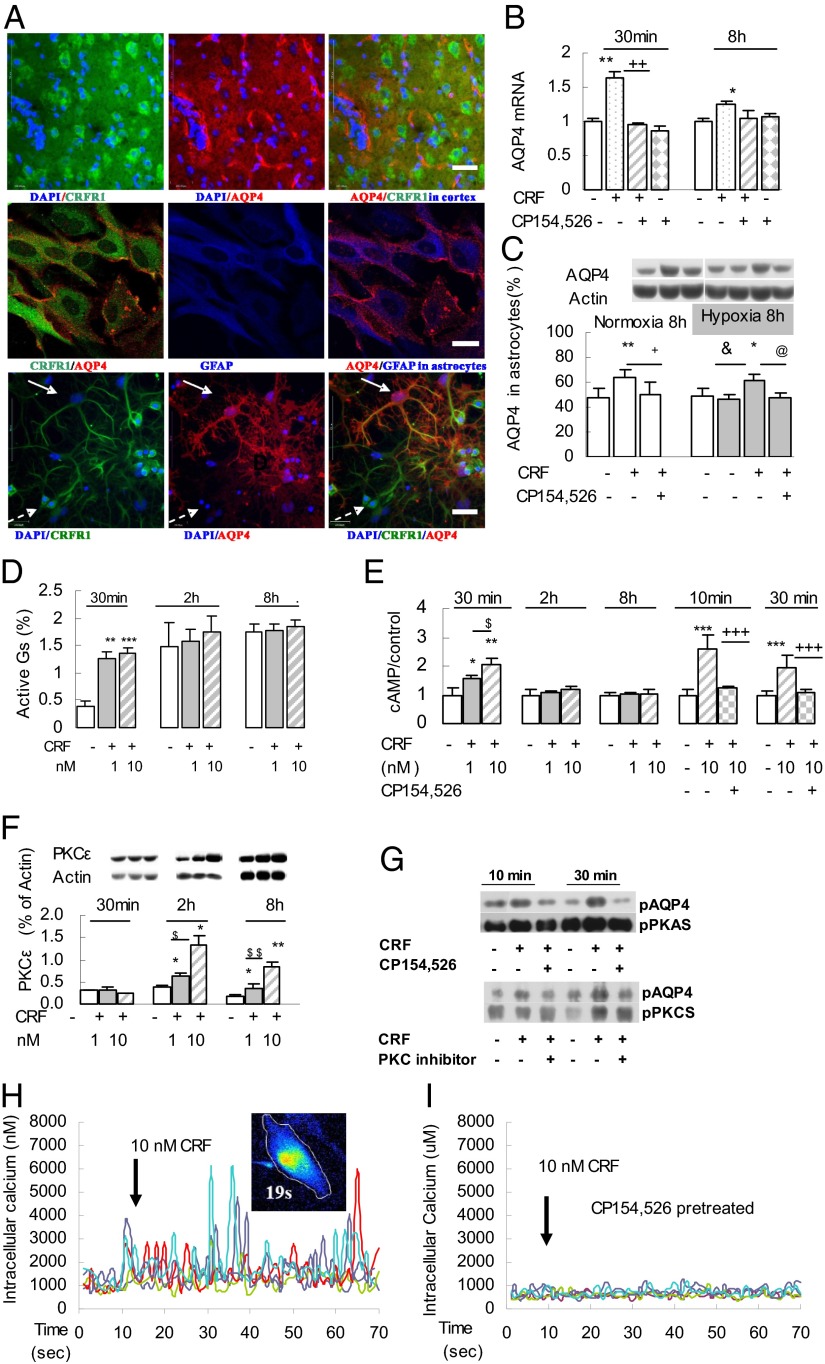
Fig. 3.
CRFR1-activated signaling pathways induced phosphorylation and transcription of AQP4 in primary cerebral astrocytes. (A) Confocal micrographs showing coexistence of AQP4 and CRFR1 in rat cerebral cortex sections (Top), cultured astrocytes (Middle), and mixed cultures of hippocampal neurons and astrocytes (Bottom). The white arrow indicates an astrocyte that expresses both CRFR1 and AQP4; the dashed white arrow indicates a neuron that expresses CRFR1 but not AQP4. [Scale bars: 100 μm (Top and Bottom); 40 μm (Middle).] (B) Exposure to CRF (10 nM for 30 min or 8 h) increased AQP4 mRNA expression in cultured astrocytes, and this increase was blocked by CP154,526. (C) CRF (10 nM for 8 h) enhanced AQP4 protein expression in astrocytes in both normoxic and hypoxic conditions that was blocked by CP154,526 (100 nM) (n = 3). *P < 0.05; **P < 0.01 (CRF vs. control); +P < 0.05; ++P < 0.05 (CRF vs. CRF antagonist); &P < 0.05 (1.0% O2 vs. CRF + 1.0% O2); @P < 0.05 (CRF + 1.0% O2 vs. CRF + 1.0% O2 + CRFR1 antagonist). (D and E) Active Gs (co-IP) and cAMP significantly increased after incubation of primary astrocytes with 1 or 10 nM CRF (30 min); CRF-induced cAMP accumulation was blocked by pretreatment with 100 nM CP154,526 (n = 3). *P < 0.05; **P < 0.01; ***P < 0.001 (CRF vs. control); $P < 0.05 (1 nM CRF vs. 10 nM CRF); +++P < 0.001 (10 nM CRF vs. 10 nM CRF + 100 nM CP154,526). (F) CRF (1 or 10 nM) induced increased expression of PKCε isoforms after 2- or 8-h incubation (n = 3). *P < 0.05; **P < 0.01 (CRF vs. control); $P < 0.05; $$P < 0.01 (CRF 10 nM vs. CRF 1 nM). (G) CRF (10 nM for 10 and 30 min) activated CRFR1-targeted AQP4 phosphorylation by PKA and PKC signaling, as shown by co-IP, and this pAQP4 was reduced by CP154,526 (100 nM; n = 3). (H and I) CRF (10 nM) activated [Ca2+]i oscillations in cultured primary astrocytes (n = 5). (H) Arrows indicate CRF added in Ca2+-free medium. (I) CRF-induced oscillations in [Ca2+]i were blocked by preincubation with CP154,526 (100 nM) in Ca2+-free medium for 30 min.

