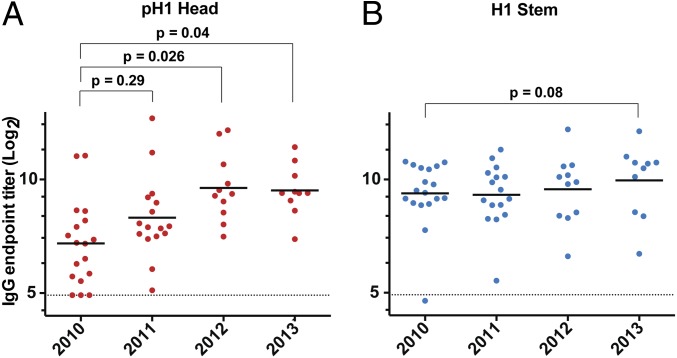
Fig. 3.
Analysis of the pH1 HA head- and H1 stem-specific IgG antibody titers over the 2010–2014 period. Prevaccination sera collected from subjects enrolled during the 2010/11 (n = 18), 2011/12 (n = 16), 2012/13 (n = 11), and 2013/14 (n = 10) influenza seasons. Geometrical mean IgG titers directed against the pH1 head (A, red) and H1 stem (B, blue) are depicted. Each symbol represents one individual. P values are from Student t tests. Dotted lines represent limits of detection.

