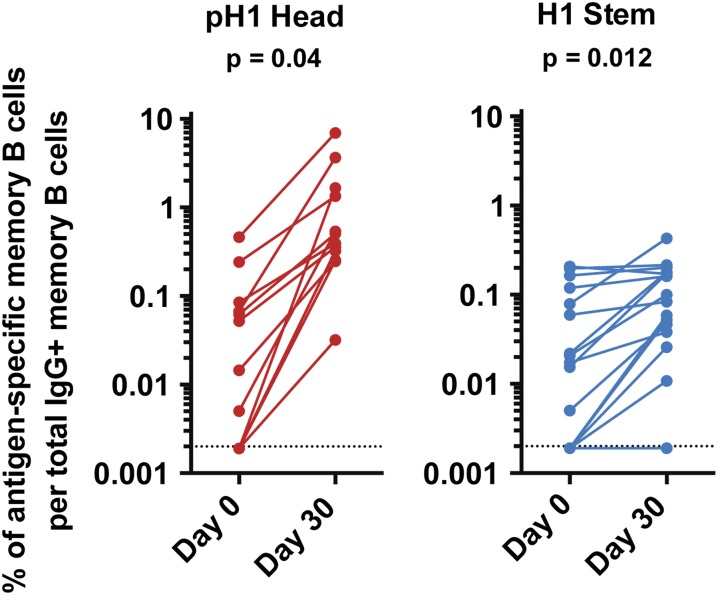
Fig. 4.
Memory B-cell responses induced following immunization with TIV. PBMCs isolated either before- or 30 d after immunization with either the 2011/12 or the 2012/13 TIV. The frequency of pre- and 30 d postvaccination levels of IgG+ memory B cells directed against the pH1 head (Left, red) or H1 stem region (Right, blue). P values are from paired Student t tests. Dotted lines represent limit of detection.

