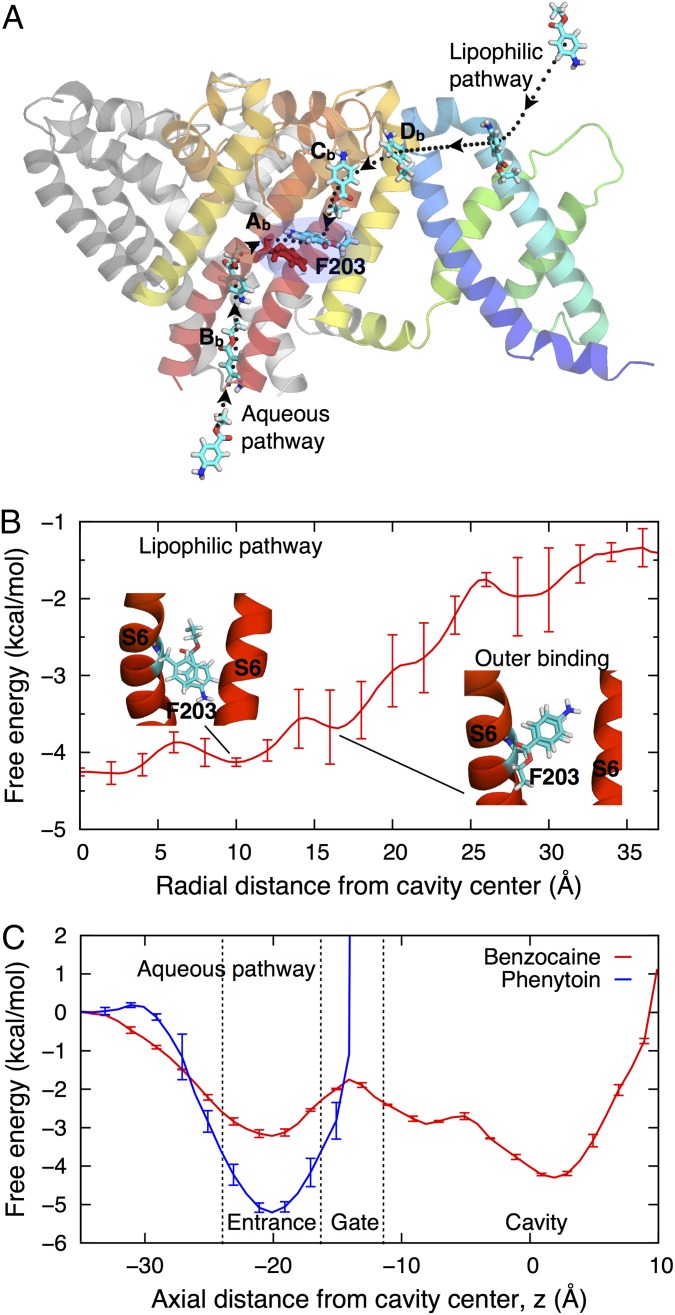
Fig. 6.
Drug-binding pathways. (A) Side view of the channel showing movement of BZC from water to the central cavity along lipophilic and aqueous pathways (dotted curves). The full PD and only one VSD subunit are shown. (B and C) The free energy profile for BZC movement through a fenestration (B) and those for BZC (red) and PHT (blue) movements through the activation gate (C). The free energy is set to zero in water, using SI Appendix, Fig. S2A to set the membrane reference for B.

