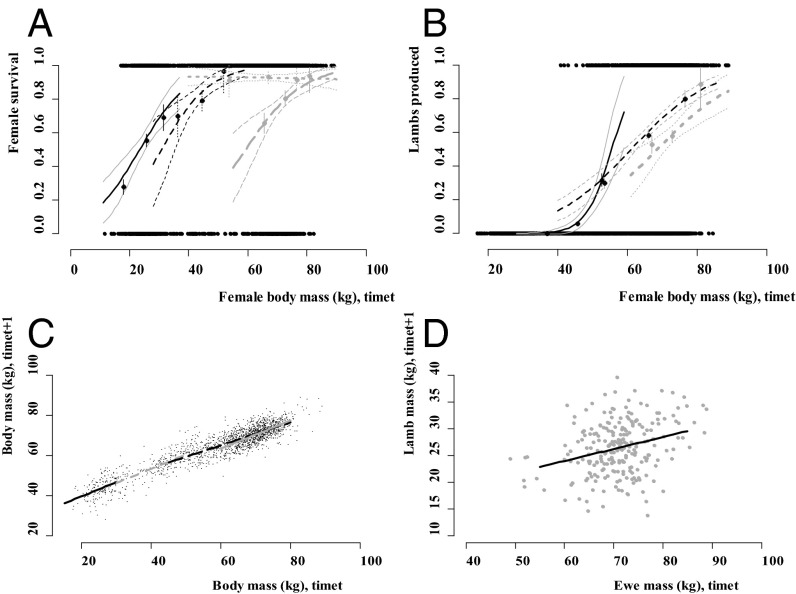
Fig. 1.
Statistical generalized linear model fits for survival, fertility, growth, and inheritance for female bighorn sheep (see full model coefficients in Tables S1–S4). (A) Female survival as a function of body mass (kilograms), where raw data over all years are plotted as 1 (survival) or 0 (mortality), on the y axis. The solid black line shows predicted model fit for lamb survival as a function of birth mass at time t, dotted black line yearling survival, small-dot gray line adult ewe survival, and dashed gray line senescent ewe survival. Confidence intervals are shown, along with empirical estimates of the data with SEs, taken as first, central, and last third bins for each age–size group. (B) Data and model fit for ewe reproductive success (at time t + 1), as lambed (1), or not (0), as a function of body mass at time t for yearlings (solid black line), adults (dashed black line), and senescents (dotted gray line). Confidence intervals and empirical estimates of data as in A. (C) Development data and linear model fit, where mass at time t + 1 for each age group is a function of mass at time t. Fitted black line is lamb growth, dashed gray line is yearling growth, dashed black line is adult growth, and solid gray line is senescent growth. (D) Inheritance data and linear model fit where lamb mass at time t + 1 is a function of pooled yearling, adult, and senescent ewe mass at time t. Note that the inheritance function within the IPM accounted for the mass of both parents.

