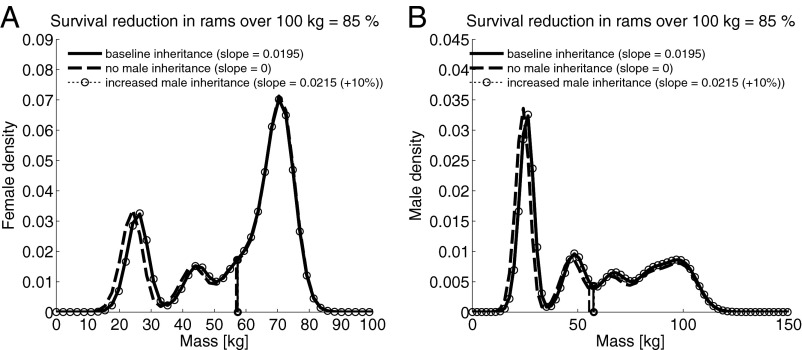
Fig. 3.
Body mass distribution for a stable population of (A) female and (B) male bighorn sheep. Data show the model distribution averaged following simulation with a stochastic model over 1,100 time steps. The black dashed line indicates mass distribution with no inheritance of mass from males (slope set to 0), the black solid line distribution indicates baseline inheritance, and the small dotted line with open circles indicates body mass distribution where the inheritance slope was increased by 10%. All three lines show body weight distribution where survival rate of rams over 100 kg is reduced through harvest by 85%.

