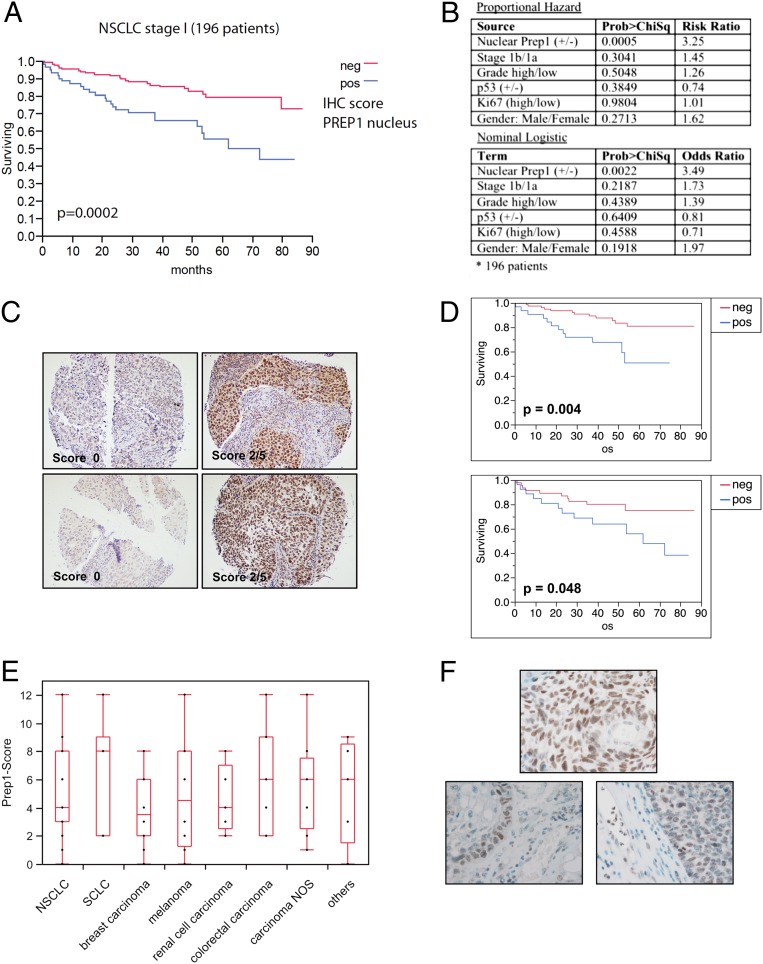
Fig. 8.
PREP1 correlates negatively with survival in patients who have NSCLC and is expressed in brain metastases of lung cancer. (A) Kaplan–Meier survival curve for 196 patients with stage 1 NSCLC who were categorized into two groups on the basis of the nuclear PREP1 IHC score. Blue trace, positive (≥1); red trace, negative (<1). (B) Multivariate analysis of PREP1 expression in patients with stage I NSCLC. The risk ratio (proportional hazard) or odds ratio (nominal logistic) were calculated with respect to the following parameters: ± nuclear PREP1 expression; stage (1b/1a); grade (high/low); ± p53 wild-type or mutated status; Ki67 (high/low); sex (male/female). (C) Representative IHC images of PREP1− (Left) and PREP1+ (Right) NSCLC tumor specimens. (Upper Row) Adenocarcinoma. (Lower Row) Squamous cell carcinoma. (D) Kaplan–Meier survival curve for the subsets of NSCLC patients affected by adenocarcinoma (Upper) or squamous cell carcinoma (Lower). (E) Summary of PREP1 expression in 104 brain metastasis from different kinds of tumors, as indicated. NOS, not otherwise specified. Scores were calculated by multiplying the PREP1-staining intensity by the frequency of positive cells (SI Appendix, SI Experimental Procedures). (F) Representative IHC images showing PREP1 expression in brain metastasis. (Upper) Strongly PREP1+. (Lower Left) Squamous cell carcinoma metastasis exhibiting strong reactivity at the tumor-stroma border. (Lower Right) Note the PREP1-negative fibrovascular stroma, whereas leukocytes show focally strong reactivity. Of 104 metastases, 101 exhibited various degrees of PREP1 immunoreactivity, from low-level staining in a few tumor cells to high uniform expression across the entire metastasis or a salt-and-pepper pattern of high- and low-expressing tumor cells.

