Fig. 3.
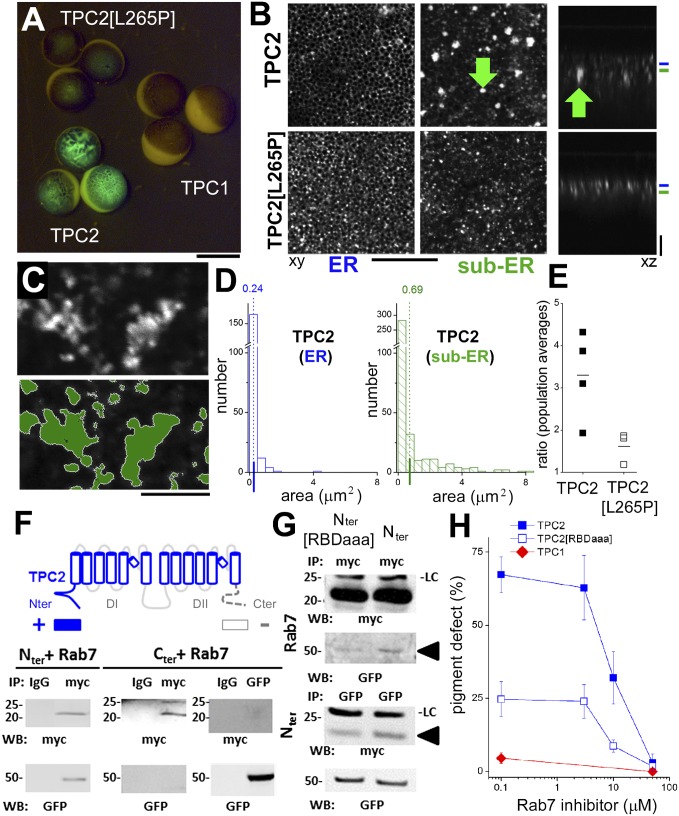
Pigment perturbation and organelle proliferation in TPC2-expressing cells. (A) Epifluorescence images of Xenopus oocytes taken 48 h after expression of GFP-tagged constructs. (Scale bar: 1 mm.) (B) Lateral (“xy,” Left and Center) and axial (“xz,” Right) images of TPC2 (Upper) and TPC2 pore mutant (TPC2[L265P], Lower) expression at the level of (blue) and beneath (green) cortical ER. Arrow, vesicular aggregates in TPC2-expressing cells in the subcortical ER. (Scale bars: “xy,” 30 µm; “xz,” 15 µm.) (C) Higher resolution image of aggregates in TPC2 cells (Upper) and morphometric analysis (Lower). The green area was quantified for analyses shown in D. (Scale bar: 2.5 µm.) (D) Histograms of vesicular size at the ER (blue) and sub-ER level (green) highlighting large vesicular aggregates in TPC2-expressing cells. (E) Morphometric comparison of TPC2 and TPC2[L265P] expressing structures via a ratio of population means of organelle size at two focal planes for TPC2 (for example, 0.69/0.24 from D) and TPC2[L265P]. (F) Rab7 interaction site(s) within TPC2. Schematic of TPC topology shows the two domain organization (DI, DII) with cytoplasmic NH2 (Nter) and COOH (Cter) termini. Regions screened positive (+, color) and negative (−, gray) for Rab7 interactivity from coimmunoprecipitation assays are highlighted as boxes. (Lower) Coimmunoprecipitation blots for MYC (Upper) and GFP (Lower) epitopes. The Nter of TPC2 binds Rab7, but reciprocal co-IPs at the COOH terminus failed to detect an interaction. (G) Coimmunoprecipitation with two NH2-terminal TPC2 domain fragments (Nter[RBDaaa] and Nter). Rab7 interaction was impaired in the Nter[RBDaaa] mutant (arrowheads) when assessed by reciprocal coimmunoprecipitation. LC, light chain. (H) Pigment phenotype in TPC-expressing oocytes in the presence of indicated concentrations of Rab7 inhibitor (Rab-I, CID1067700). Data represent means ± SEM.

