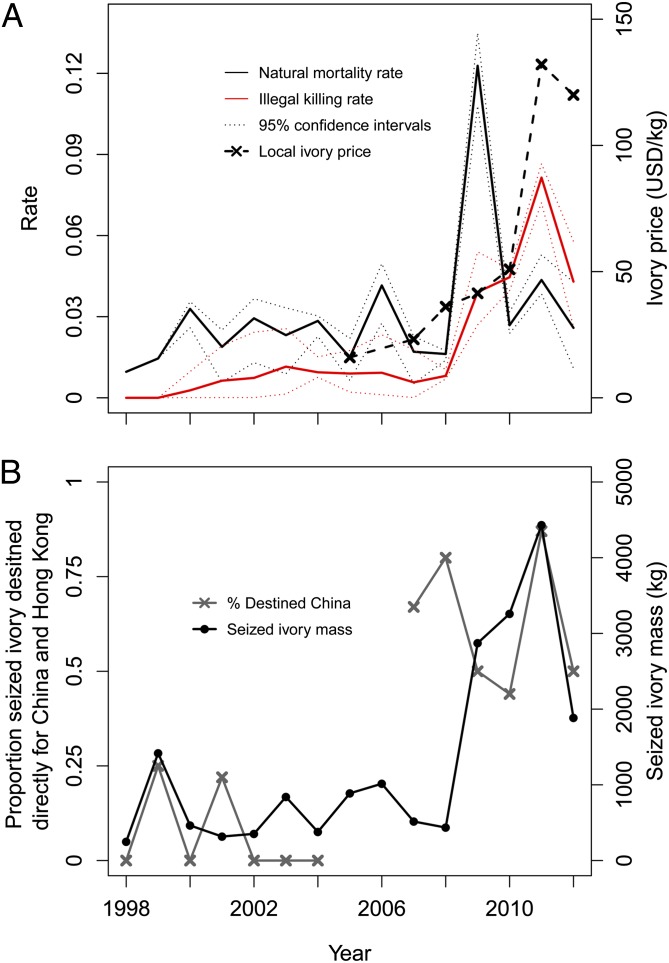
Fig. 1.
(A) Estimated natural (gray line) and illegal killing (red line) rates (with 95% confidence interval) contrasted with local prices of ivory (black line) to the poachers in the Laikipia/Samburu ecosystem. (B) Mass of annual ivory seizures in Kenya (no data in 2005–2006) and the proportion of seizures destined for China (including Hong Kong). Data is represented by a black or gray “×.”

