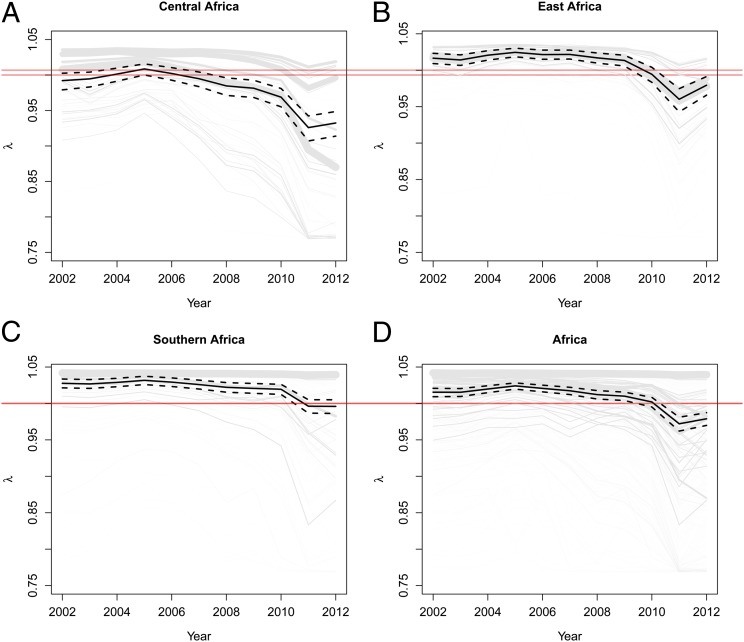
Fig. 2.
Modeled trends in annual population changes between 2002 and 2012 for 306 elephant populations across Africa presented by region: (A) Central, (B) East, and (C) Southern Africa regions and (D) all combined. Gray lines represent the site-specific annual population changes, where the thickness represents relative population size. Black lines represent the aggregate trends. Dashed lines represent the 95% confidence interval of aggregate trends.

