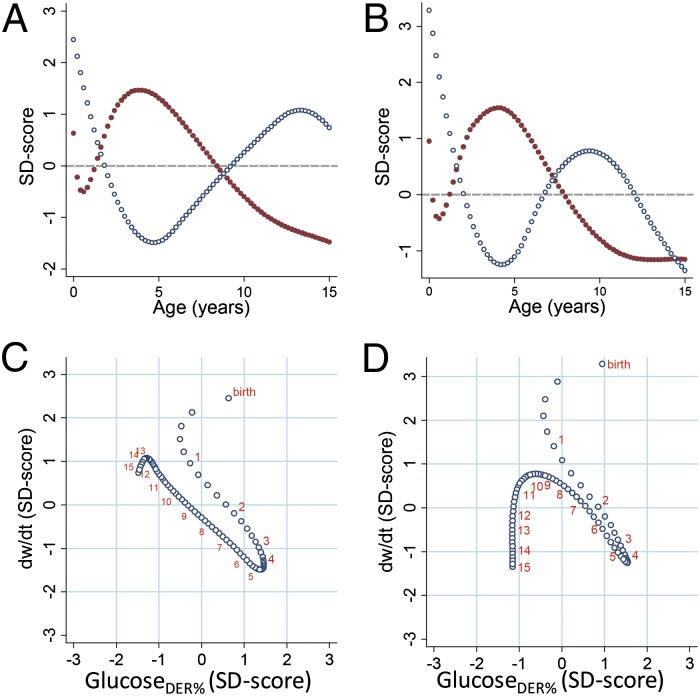
Fig. 3.
Glucoseder% and body-weight growth rate. Glucoseder% and weight velocities plotted as SD scores to allow unitless comparison. (A) Glucoseder% (red dots) and dw/dt (blue dots) by age in males. (B) Glucoseder% (red dots) and dw/dt (blue dots) by age in females. (C) Weight velocity vs. glucoseder% in males. (D) Weight velocity vs. glucoseder% in females. For reference, orange numbers indicate ages at yearly intervals (C and D).

