Fig. 4.
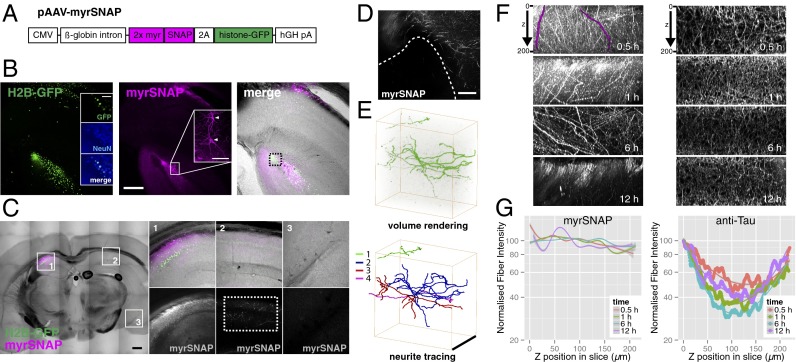
Chemical labeling of the mouse brain. (A) Virus construct for chemical labeling of mouse brain. (B) A 200-µm coronal vibratome slice from a mouse brain injected with AAV-myrSNAP into hippocampus, stained with BG-549 (SI Materials and Methods). Insets show counterstaining against the neuronal marker NeuN (Left) and individual labeled neurons (Middle, arrowheads). (Scale bars: 250 µm in overview panels; 100 µm in Insets.) (C) Overview scan of a coronal vibratome slice from mouse brain unilaterally injected with AAV-myrSNAP into hippocampus and stained with BG-549 (Left). Numbered boxed areas 1–3 are expanded on the right. Single contralateral SNAP-positive projections are visible on the noninjected side (C, 2, Lower Right). (Scale bar: 500 µm.) (D) Background labeling from BG-549 is very low in zones devoid of transfected neurites (area below the dashed line; see box in B, Right). (Scale bar: 100 µm.) (E) Volume rendering of the area indicated by the dashed rectangle in C, 2, Lower Right). The high signal-to-noise ratio of BG-549–labeled processes allows facile 3D reconstruction. Four separate traced neurites are shown in different colors. (Scale bar: 200 µm.) (F) Side views of maximum-projected 3D confocal stacks of brain slices labeled with myrSNAP (Left, samples from B) or stained with anti-Tau antibody (Right) are shown with incubation times indicated. Two individual neurites are highlighted in magenta. (G) The intensity profile along the z axis for individual SNAP-labeled fibers was quantified (n = 9–11 per condition) (SI Materials and Methods). Then the normalized intensity profile was plotted for each labeling time (Left). For Tau staining, image intensity was quantified directly, because all neurons are labeled (Right) (SI Materials and Methods).

