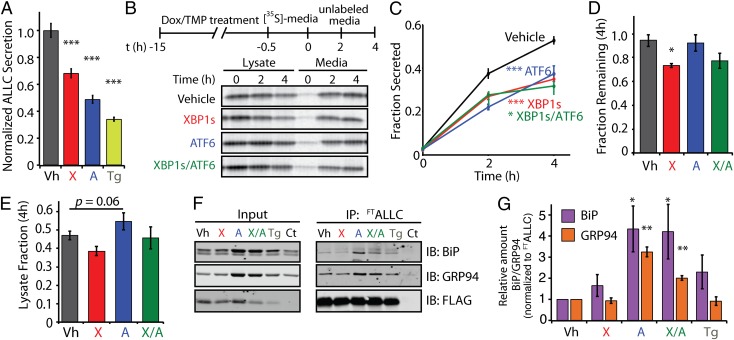
Fig. 3.
Stress-independent activation of XBP1s and/or ATF6 decreases the secretion of amyloidogenic LC. (A) ALLC levels determined by ELISA in conditioned media from HEK293DAX cells (40) expressing FTALLC following a 15-h preactivation of XBP1s (X; Dox, 1 μg/mL) or ATF6 (A; TMP, 10 μM) or by thapsigargin-induced stress (Tg, 500 nM). ALLC secretion levels were normalized to vehicle (Vh; DMSO) conditions (n = 3). (B) Representative autoradiogram of [35S]-labeled FTALLC immunopurified from media and lysates collected from transfected HEK293T-Rex cells following a 15-h preactivation of XBP1s (X; Dox, 1 μg/mL), ATF6 (A; TMP, 10 μM), or both (X/A). The metabolic labeling protocol used is shown. (C) Quantification of fraction secreted from autoradiograms as shown in B (n ≥ 3). (D) Graph depicting the total [35S]-labeled FTALLC remaining at 4 h in lysate and media following a 15-h preactivation of XBP1s, ATF6, or both in HEK293DAX (n ≥ 3). (E) Graph depicting the total intracellular [35S]-labeled FTALLC in lysates at 4 h in HEK293DAX cells following a 15-h preactivation of XBP1s, ATF6, or both (n ≥ 3). The lysate fraction was calculated by dividing the lysate [35S]-labeled FTALLC signal at 4 h by the total [35S]-labeled FTALLC at t = 0. (F) Immunoblot showing the recovery of the ER chaperones BiP and GRP94 in FLAG immunopurifications from cross-linked HEK293DAX cells expressing FTALLC following 15-h pretreatment with thapsigargin (Tg), XBP1s (X), ATF6 (A), or XBP1s and ATF6 (X/A), as in B. HEK293DAX cells expressing untagged ALLC is shown as a control (Ct). (G) Quantification of F achieved by comparing the signal under various conditions to vehicle, and by normalizing to the recovered FTALLC. *P < 0.05; **P < 0.01; ***P < 0.005. All error bars represent the SEM from biological replicates.

