Figure 1.

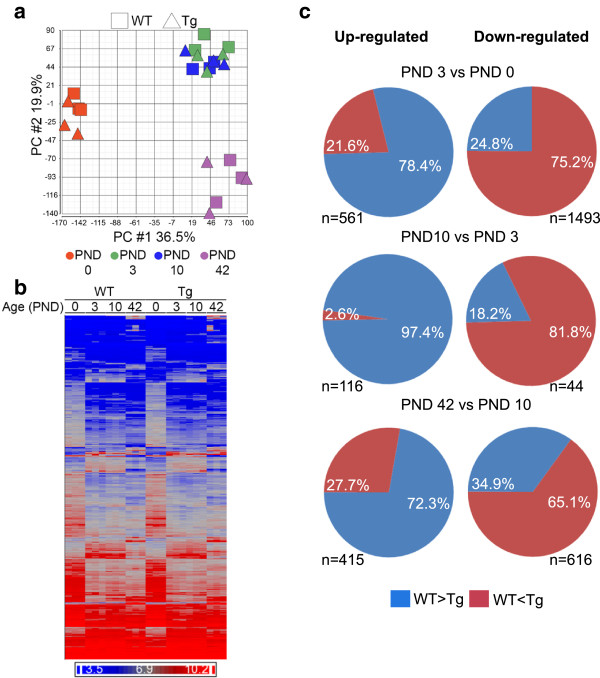
Gene expression patterns in WT and Scnn1b -Tg whole lung. (a) Principal component analysis (PCA) of gene expression from WT and Scnn1b-Tg whole lungs at PND 0, 3, 10, and 42 plotted in two-dimensional space using the first two principal components, which together constitute 55.4% of the overall variance in this study. Squares = WT; Triangles = Scnn1b-Tg. Each symbol represents the results of a single microarray. Each symbol represents a pool of animals as described in the methods. N = 3 pools for each age and genotype. Age is designated by color: PND 0 (red), PND 3 (green), PND 10 (blue), and PND 42 (purple). (b) Unsupervised hierarchical clustering of the combined set of differentially expressed genes (DEGs) that survive the filtering criteria (FDR ≤ 0.05, fold-change ≥ 2) across development (comparing PND 0 to all other time points for each genotype, i.e., WT and Scnn1b-Tg; total genes represented = 4514; Additional file 2: Results file S1). Dark blue indicates lower expression levels and bright red indicates higher expression levels, and each column represents the results of one microarray N = 3 for each genotype at each age). (c) Pie charts highlighting the shift in expression of developmentally regulated genes due to Scnn1b-Tg expression. Each row represents a different developmental interval and each pie chart represents the pattern for the genes that are differentially regulated (fold-change >2.0; FDR < 0.05) in WT mice. Genes normally up-regulated in WT mice are represented in the left column and genes normally down-regulated are represented in the right column, with the number of gene shown for each piechart. The percentages represent the genes that are either higher or lower (blue and red, respectively) in WT vs Scnn1b-Tg at the later developmental stage represented by the interval.
