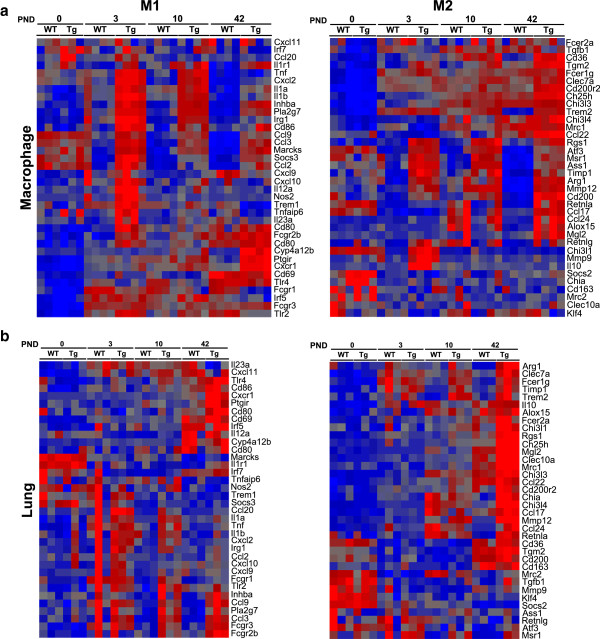
Figure 5.

M1 and M2 DEG signatures in Scnn1b -Tg macrophages and whole lung. Heat-maps from normalized expression values of M1 and M2 macrophage-activation-related genes (see gene list in Additional file 6: Results file S4 under headings "Macrophage M1 Activation" and "Macrophage M2 Activation") in purified macrophages (Panel a) and whole lung (Panel b). Higher and lower expression is represented by red and blue, respectively; with each individual heat-map produced separately (each heat-map has its own unique range of values indicated by dark blue to bright red). The corresponding data can be found in Additional file 6: Results file S4. Each column represents data from one array (n = 3 for lung; n = 4 for other macrophage groups for each genotype), with WT or Scnn1b-Tg (Tg) status listed above the columns. Each row represents a single gene.
