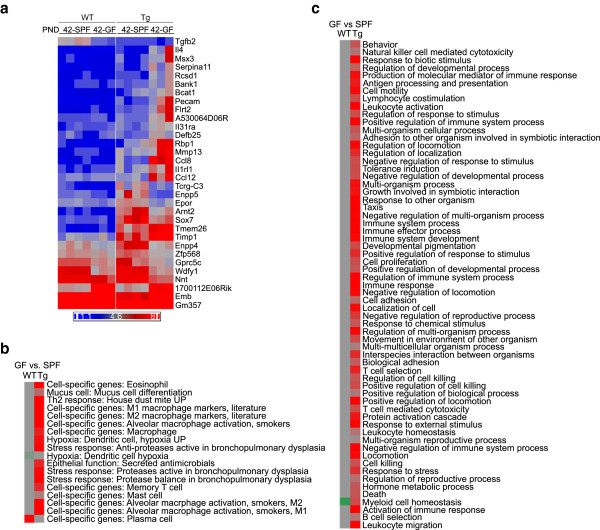
Figure 7.

Gene expression patterns in germ-free (GF) macrophages compared to specific-pathogen free (SPF) environments. (a) Unsupervised hierarchical clustering of the small set of DEGs that are either differentially expressed between SPF and GF WT macrophages (shown on left) or between SPF and GF Scnn1b-Tg macrophages (shown on right) purified from PND 42. Gene symbols are shown to the right. Each column represents expression from a single microarray (n = 3 for GF; n = 4 for SPF). Filtering for DEGs and colors are as described as in Figure 2. GSEA analyses for custom gene-set (b) and multiple immune system pathway (c) and Gene Ontology annotations comparing SPF versus GF WT macrophages (left column) or SPF versus GF Scnn1b-Tg macrophages (right column). Color coding and significance parameters were as in Figure 4. The corresponding data can be found in Additional file 8: Results file S6.
