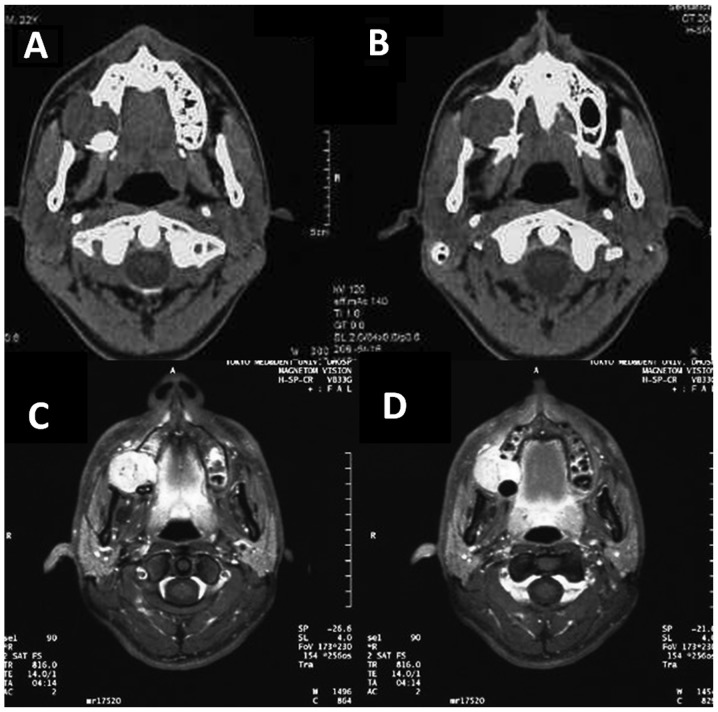
Figure 3.
(A and B) Computed tomography (CT) and (C and D) Axial contrast-enhanced magnetic resonance imaging (CE-MRI). (A) Axial CT image revealing a globular-shaped lesion arising from the inside maxillary bone with destruction of its posterior wall and alveolar bone. (B) The lesion exhibited intermediate signal intensity on T1-weighted imaging, and heterogeneous high signal intensity on T2-weighted and short TI inversion-recovery imaging. (C and D) CE-MRI revealed a distinctly-bordered lesion (31×30 mm) extending from the right maxillary alveolar process to the right palate and reaching the retromaxillary fat space.

