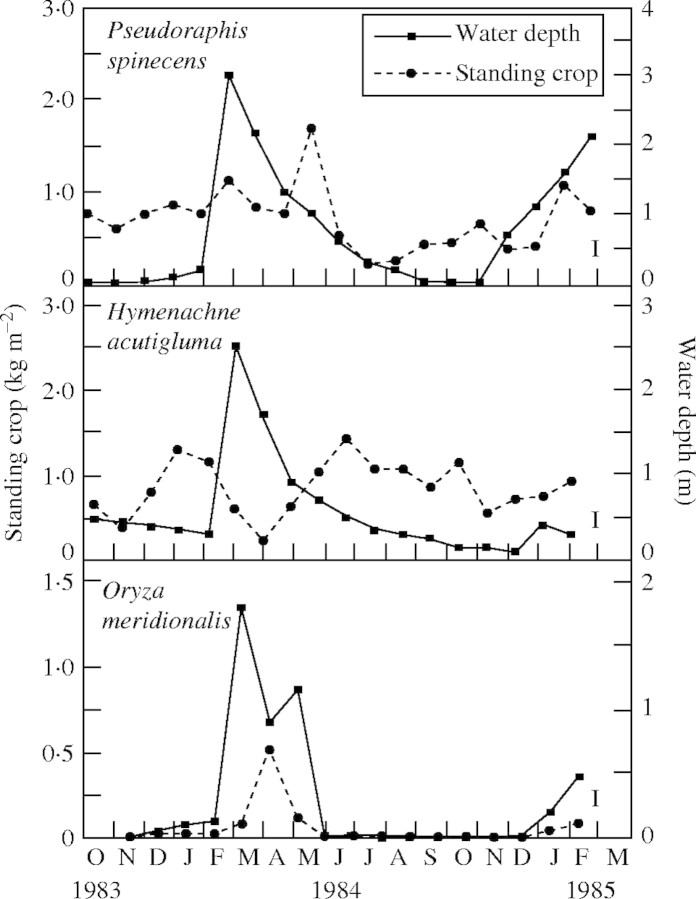
Fig. 7.
Above-ground dry biomass of three aquatic grass species (from Finlayson, 1991). The data were obtained from five quadrats (1 m2) placed in each community at approx. 4 weekly intervals throughout the sample period. The least significant difference (P = 0·05) is shown for each species.

