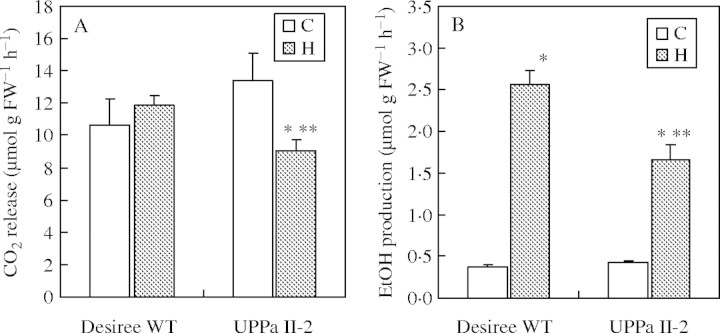
Fig. 3.
Glycolytic rates in excised roots of wild-type (Desiree WT) and transgenic potato plants (UPPa II-2) following 4 d of hypoxia (H) compared with aerated controls (C). (A) The CO2 release [μmol g FW−1 h−1] was measured with a Warburg apparatus under aerated conditions as described in Materials and Methods. (B) Ethanol production rate was measured enzymatically during anoxic incubation of excised roots (for 2 h). Values are the means ± s.e. of at least three independent experiments with three samples each. Asterisks show significant changes between aeration and hypoxia (*) and between wild-type and transgenic plants (**) at the 5 % level (t-test).

