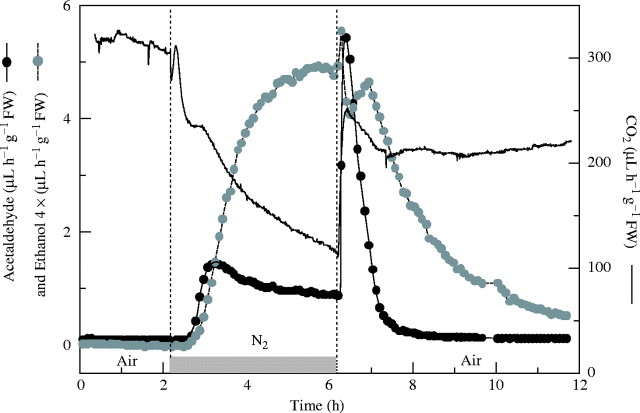
Fig. 1.
Effect of 4 h anaerobic treatment and subsequent relief from anaerobiosis on patterns of ethanol (grey circles), acetaldehyde (black circles) and CO2 (black line) emissions from single batches of three 14-d-old CT6241 rice seedlings. At t = 0 h, plants were placed in air in the dark. At t = 2·1 h, they were given an anaerobic treatment for 4 h (light grey bar) followed by a 4 h re-aeration period. One representative measurement selected from four or five independent experiments is shown.

