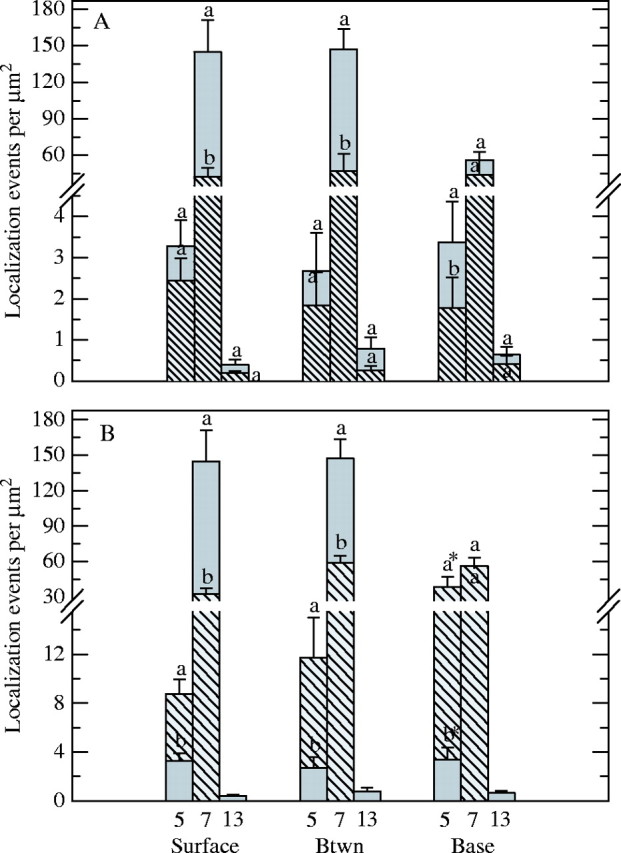
Fig. 5.

Density of anti-JIM7, anti-JIM5 and anti-JIM13 localization in the ECM at the surface, between (Btwn) and base of stigmatic (A and B, solid bars), abaxial (A, hatched bars) and adaxial (B, hatched bars) epidermal cells of Sarcandra glabra. Values labelled with a different letter at each position for each antibody are significantly different from one another at P ≤ 0·05. Error bars represent 95 % confidence interval. Note brake in y-axis. Asterisk labelling hatched bar for anti-JIM5 localization (B) represents density values for ECM at base of papillate versus tabular cells on opposing side of site of angiospermy where anti-JIM5 localization was only 4× that of stigmatic epidermal cells (data not shown).
