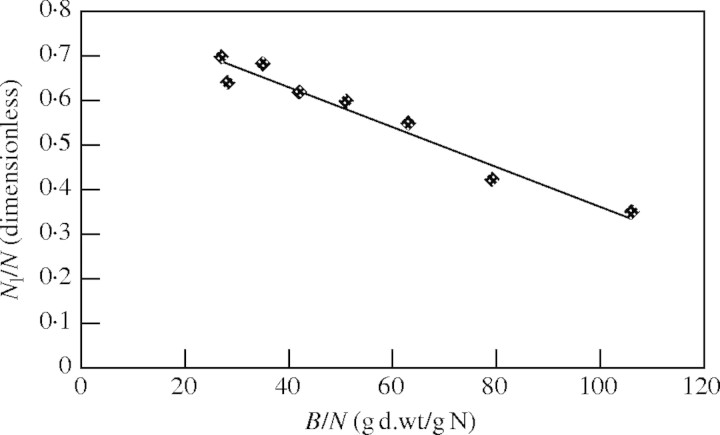
Fig. 1.
Nitrogen allocation of birch as a function of the inverse of nitrogen concentration. The line fits to the function y = −0·0043x + 0·795 [Pearson r = 0·981; significant at 0·01 level (two-tailed)]. Linearity was tested by residual analysis and showed no reason to deviate from linearity. Data obtained from Ingestad et al. (1994).

