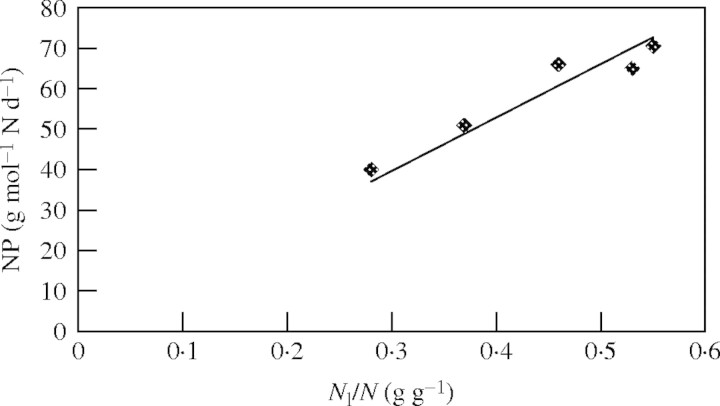
Fig. 2.
Nitrogen allocation of Dactylis glomerata as a function of nitrogen productivity (NP). Best fit was obtained with the function y = 114·2x + 8·292 [Pearson r = 0·975; significant at 0·01 level (two-tailed)]. The drawn line was forced through zero and fits to the function y = 132·2x (r2 = 0·9264). Linearity was tested by residual analysis and showed no reason to deviate from linearity. Values of Nl/N and NP are based on Van der Werf et al. (1993a), as explained in the text.

