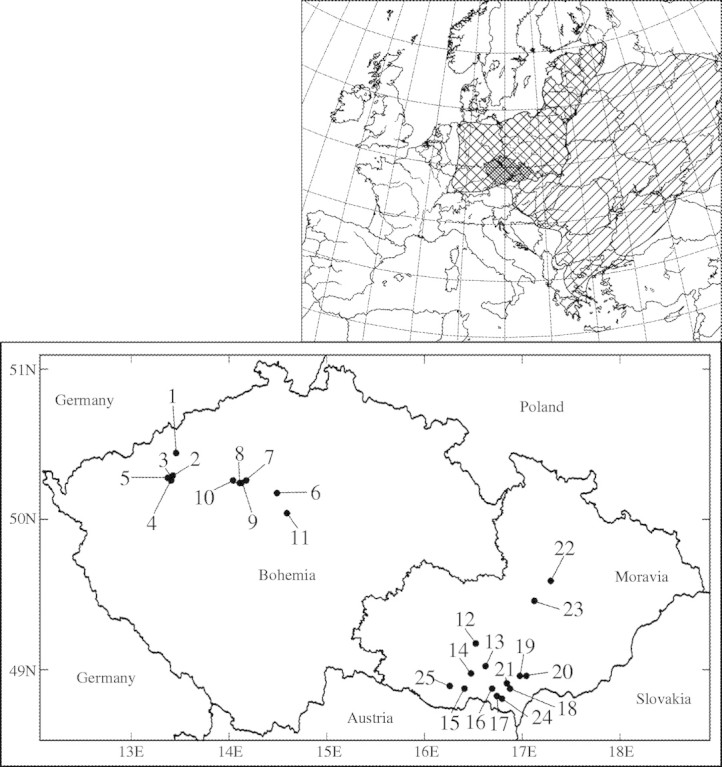
Fig. 1.

Map showing the total distribution of Atriplex tatarica in Europe (redrawn from Jalas and Suominen, 1988). The shaded area indicates native area distribution of A. tatarica and the cross-hatched area indicates secondary area distribution in Europe (Jalas and Suominen, 1988). The detailed map of the Czech Republic shows the location of the 25 populations of A. tatarica used in this study.
