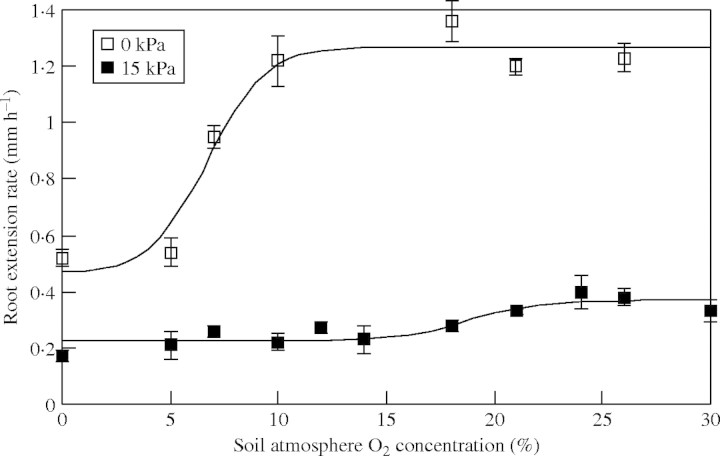
Fig. 6.
Rates of root extension of unimpeded (0 kPa) or impeded (15 kPa) roots at O2 concentrations ranging from 0 to 30 % in the root environment. Observations are means ± s.e. The non-linear regression of logistic curves fitted was highly significant (P < 0·001); the two fitted logistic curves (for 0 kPa and 15 kPa roots, respectively) were significantly different (P < 0·001) and explained 97 % of the variance.

