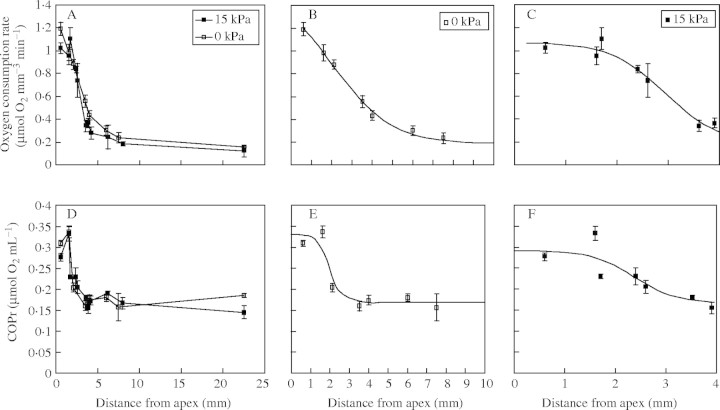
Fig. 8.
(A) Local O2 consumption rate (µmol mm−3 min−1) in the terminal 22 mm of unimpeded or impeded roots and (D) COPr values of roots over the same region. (B) and (E) show data from the unimpeded roots while (C) and (F) show data from impeded roots. (B) and (E) present data for the 10-mm-long elongating zone of unimpeded roots, while those in (C) and (F) present data for the 4-mm-long elongating zone of impeded roots. (B) and (C) are derived from (A) with fitted curves included, while (E) and (F) are derived from (D) (note symbols within the figures). The non-linear regressions of logistic curves fitted to (B), (C), (E) and (F) were highly significant (P < 0·001): in each case the fitted logistic curves were significant (P < 0·001) and explained between 85 and 98 % of the variance. Observations are means ± s.e. Straight lines connecting points in (A) and (D) are for ease of distinguishing treatment type.

