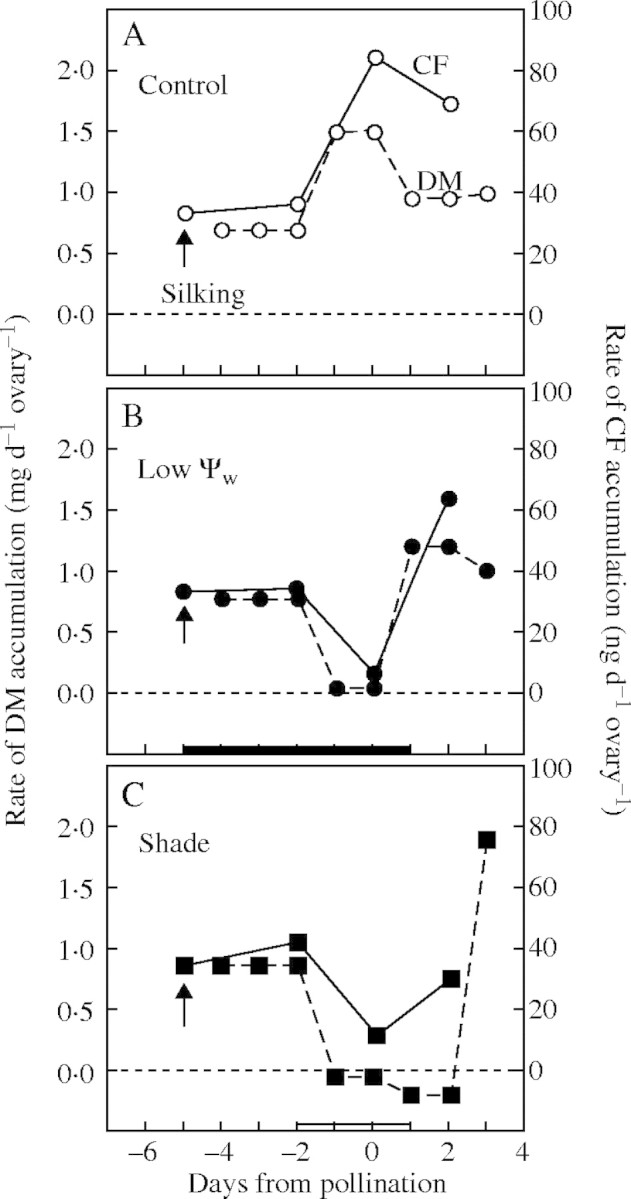
Fig. 8.

Comparison of mean rates of dry mass (DM) and carboxyfluorescein (CF) accumulation per day during the experiments. (A) Control, (B) low Ψw, and (C) shade. Rates of DM accumulation were calculated from the slope of the means shown in Fig. 1D. Rates of CF accumulation are means from Fig. 5P. The black bar on the abscissa indicates when water was withheld from the soil and the white bar indicates the time of shading.
