
Fig. 3.
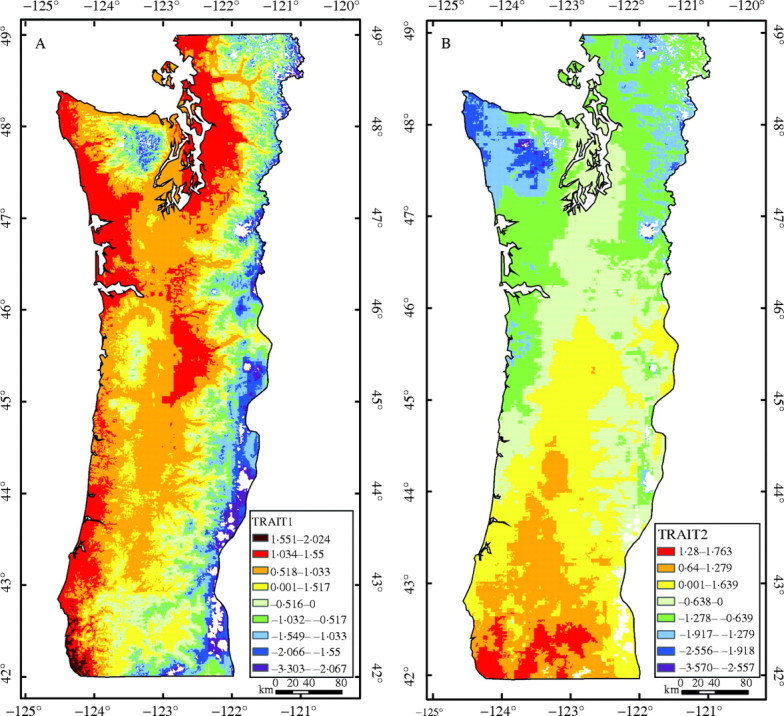
Geographical variation in (A) the first and (B) the second canonical variables for traits (TRAIT1 and TRAIT2, respectively). Mean values are shown as the zero contour between yellow and light green. Contour intervals represent a 30 % level of risk of maladaptation from source movement.