
Fig. 4.
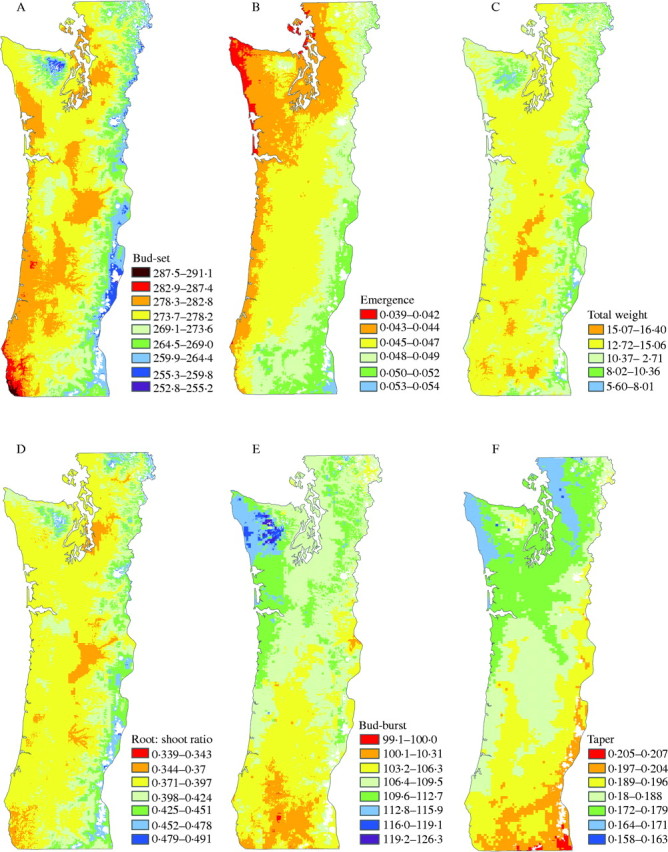
Geographical variation in traits of (A) first-year bud-set, (B) rate of emergence, (C) total weight, (D) root-to-shoot ratio, (E) second-year bud-burst and (F) taper. Mean values are shown as the contour between yellow and light green. Contour intervals represent a 30 % level of risk of maladaptation from source movement.