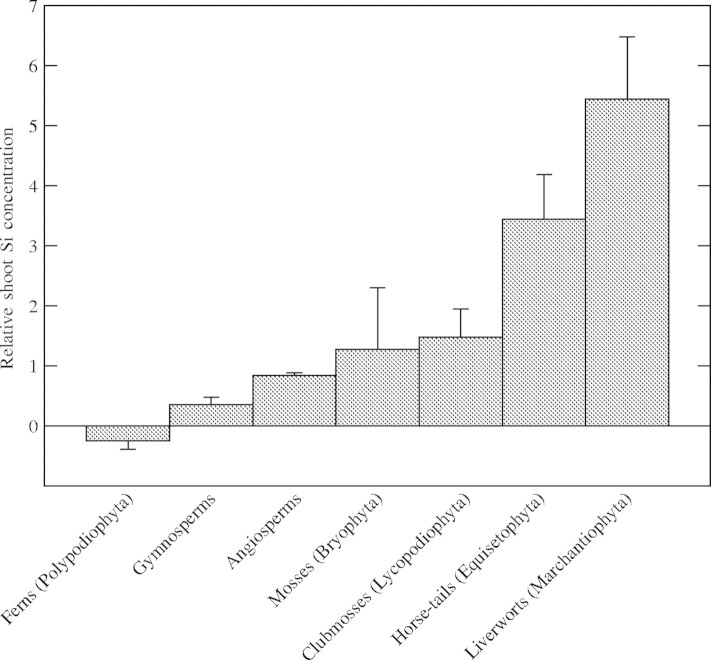
Fig. 3.
Mean (± s.e.m.) relative shoot Si concentration of seven groups of plants (one-way ANOVA, F6,728 = 18·11, P < 0·001, residual mean square = 1·053). Silicon concentrations in leaf or non-woody shoot tissues of 735 plant species were obtained from 125 independent studies reported in 54 papers in the primary literature. Standard errors of differences of means (s.e.d.) between groups can be calculated as √{residual mean square * [(1/n1) + (1/n2)]}. Groups are ranked from lowest to highest mean relative shoot Si concentration: ferns (n = 59), gymnosperms (67), angiosperms (600), mosses (1), clubmosses (5), horse-tails (2), liverworts (1).

