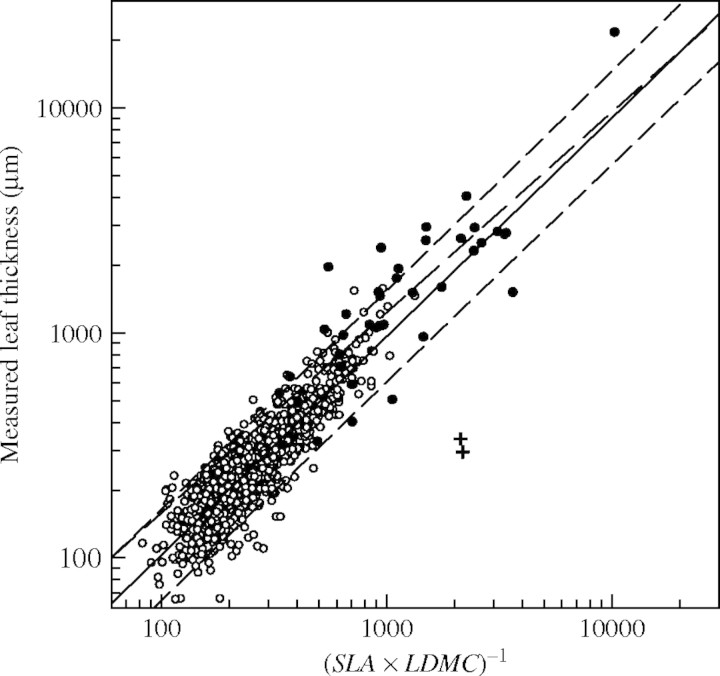
Fig. 2.
Linear regression relationships between measured leaf thickness (LT, μm) and the inverse of the product of specific leaf area (SLA, m2 kg−1) and leaf dry matter content (LDMC, mg g−1) for all studies (open circles) and for succulent-leaved species (filled circles with outliers, Crassula sp. and Euphorbia sp. indicated by crosses). Regression line (continuous line) plus prediction intervals (short dashed lines) for all studies shown in Fig. 1A, and regression line for succulent-leaved species (long dashed line) are shown. Note the logarithmic scales. Regression equation for succulent-leaved species: log (LT) = 0·43 + 0·89 log [(SLA × LDMC)−1]; r2 = 0·70; n = 38.

