
Figure 5.
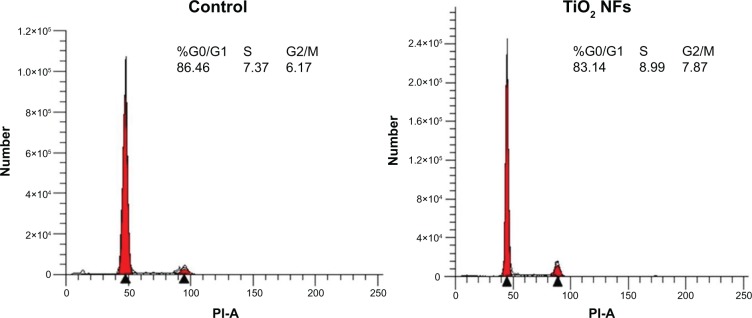
Representative DNA histogram of ADSCs cultured on control Ti-6Al-4V surfaces and TiO2 nanofibrous surfaces.
Note: The percentages of cells residing in the G0/G1 phase, S phase, and G2/M phase are shown in the histograms.
Abbreviations: ADSCs, adipose-derived stem cells; NFs, nanofibers; PI-A, propidium iodide-area.