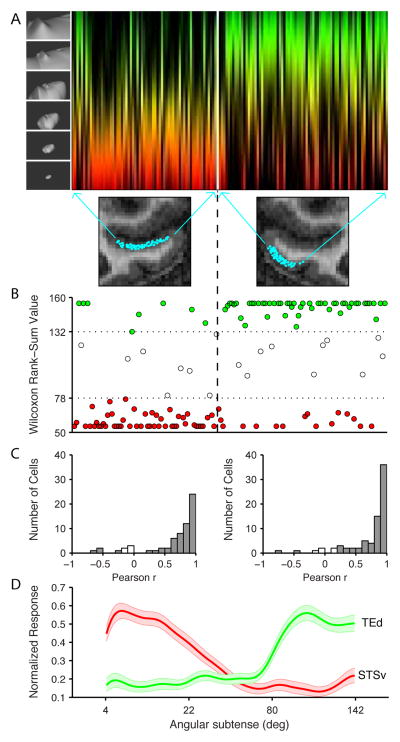
Figure 2.
Population results. (A) The scale-tuning function of each neuron (n = 141) is plotted as a vertical strip. Color represents scale, as in Fig. 1D,F, ranging from small objects (red) to large environments (green). Brightness at each point along the vertical strip is proportional to the average normalized response strength across all stimuli at the corresponding scale in the upper half of the neuron’s response range. Neurons are arranged along the horizontal axis based on their positions in the coronal plane along the STSv and TEd channels (see MRI images and arrows). (B) For each neuron, we plot the result of a Wilcoxon rank-sum test based on the 10 highest response environmental stimuli (subtending > 80°) as compared to the 10 highest response objects (subtending < 22°). The rank-sum value can vary from 55 (if the environmental stimuli occupy all the lower ranks, 1–10) to 155 (if the environmental stimuli occupy all the higher ranks, 11–20). Dashed lines indicate significance thresholds (p < 0.05, two-tailed). Significant neurons are plotted in red (object) or green (environment). Neurons are ordered along the horizontal axis as in (A). (C) Distributions of Pearson correlations between scale-tuning functions in the two independent lineages for each neuron. Filled bars represent significant correlations (p < 0.01). (D) Average normalized response levels in STSv (red) and TEd (green) as a function of stimulus diameter. The shaded regions represented the 95% confidence interval of average response values. See also Fig. S2.

