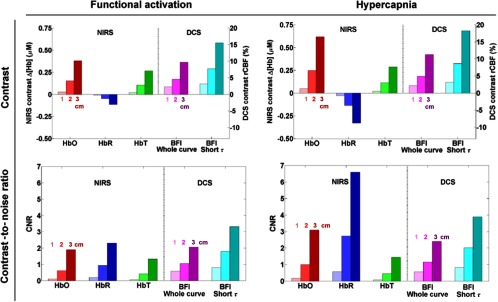
Fig. 3.

Monte Carlo simulations of the contrast (top) and CNR (bottom) of NIRS and DCS, in response to functional activation (left) and hypercapnia (right). The bar heights show the median value across the eight probe locations. For each parameter, the three bars of increased darkness in the same color show the results at 1, 2, and 3 cm, respectively. For DCS, we present the cases where the whole autocorrelation curve is fit (magenta), and when only the early delays corresponding to are fit (cyan).
