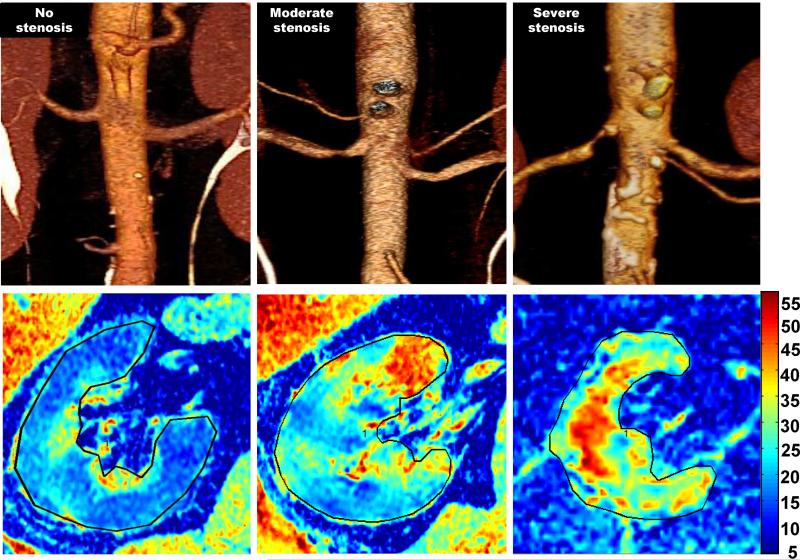
Figure-1.
CT angiographic images (upper row) of the right kidneys illustrating three patients with 1) no renal artery stenosis 2) moderate renal artery stenosis and 3) severe renal artery stenosis. Below each in the bottom row are corresponding R2* parametric maps illustrating higher fraction of axial images with elevated deoxyhemoglobin evident with progressively more severe disease.

