. 2014 Sep 2;2(39):6723–6729. doi: 10.1039/c4tb01129e

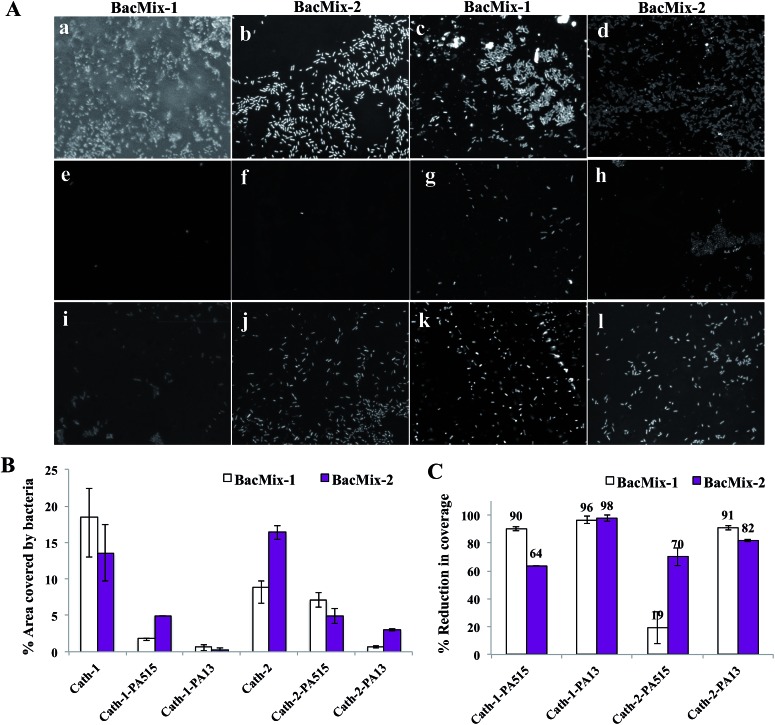
Fig. 2. (A) Confocal fluorescence images (× 40 magnification, λ ex 405 nm, λ em 414–502 nm) of catheter surfaces showing bacteria binding/non-binding. The images were obtained after 72 h incubation with bacteria, followed by washing, fixing and staining with DAPI (1 μg mL–1). (a and b) uncoated Cath-1, (c and d) uncoated Cath-2, (e and f) Cath-1–PA13, (g and h) Cath-2–PA13, (i and j) Cath-1–PA515, (k and l) Cath-2–PA515. (B) The percentage of surface area covered by bacteria after 72 h incubation with BacMix-1 and BacMix-2, and (C) percentage of reduction in bacteria binding, obtained by comparing the area of bacteria coverage to the area of the image (n = 3, see ESI).

Fig. 2