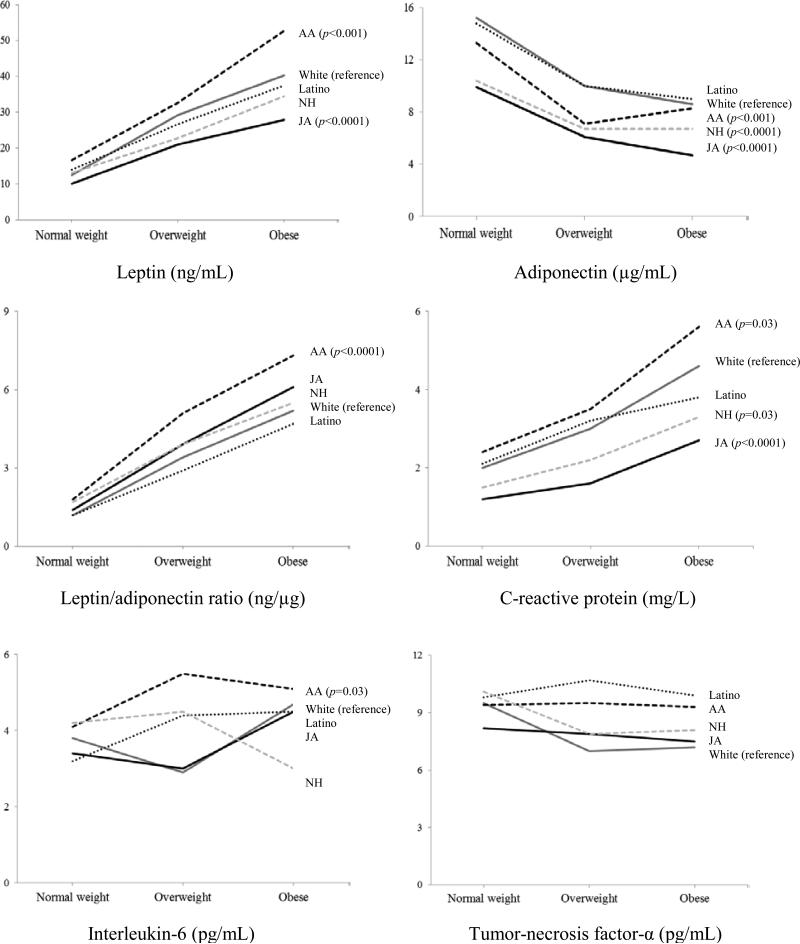
Figure 2.
Geometric mean biomarker levels by ethnicity across weight categories in women after adjustment for log-transformed continuous BMI, month of blood draw (categorical), and laboratory analysis batch number (categorical). White = gray solid line; Japanese American (JA) = black solid line; Latino = black dotted line; African American (AA) = black short-dash line; and Native Hawaiian (NH) = gray short-dash line. P values in parentheses present significant differences from whites (reference group) after adjustment for log-transformed body mass index (continuous), month of blood draw (categorical), and laboratory analysis batch number (categorical).

