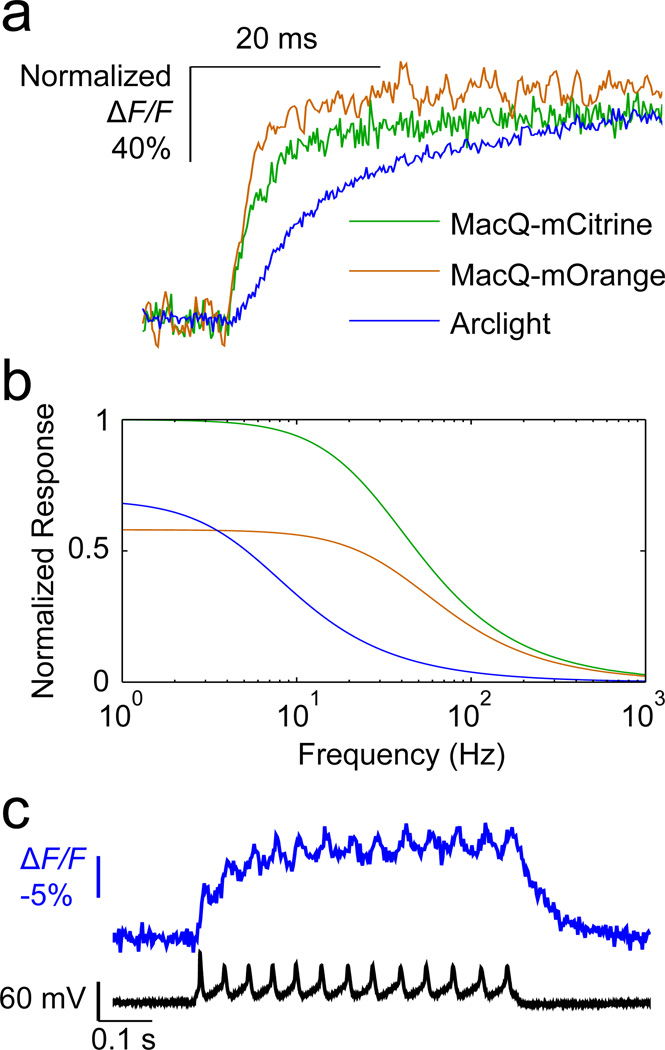
Figure 4. The rapid kinetics of MacQ sensors provide a superior frequency response curve as compared to Arclight.
(a) Step responses of the MacQ sensors and Arclight to command voltage steps of +100 mV from a holding of −70 mV, normalized to the maximum (or steady-state) ΔF/F response to the command voltage (average of n = 3–6 trials for each construct). MacQ sensors exhibited three- to four-fold faster rise times than that of Arclight. Illumination intensities were 15–50 mW mm−2 at the specimen plane. We used a photomultiplier tube to attain a 5 kHz data acquisition rate.
(b) To estimate each voltage sensor’s frequency response curve, we used the step response measurements from (a), the sensors’ empirically determined brightness values, and the sensors’ empirically determined time constants (Methods). Our calculations assumed these time constants were invariant across different holding potentials and voltage steps. Although this assumption is surely wrong for large voltage changes, it simplified the calculations while providing basic insights. MacQ-mCitrine substantially outperformed Arclight at all frequencies, due to MacQ-mCitrine’s faster kinetics, higher brightness, and superior SNR.
(c) Electrophysiological and optical traces simultaneously acquired from a cultured neuron expressing Arclight (blue trace). The neuron exhibited repeated spiking during a period of constant current injection, and throughout the spike train there was a sustained increase in Arclight’s baseline fluorescence. As with isolated spikes, Arclight reported action potentials with small ΔF/F (<3%) values and without visible after-hyperpolarizations. Illumination intensity was 15 mW mm−2 (λ = 480 nm). The frame acquisition rate was 440 Hz.

