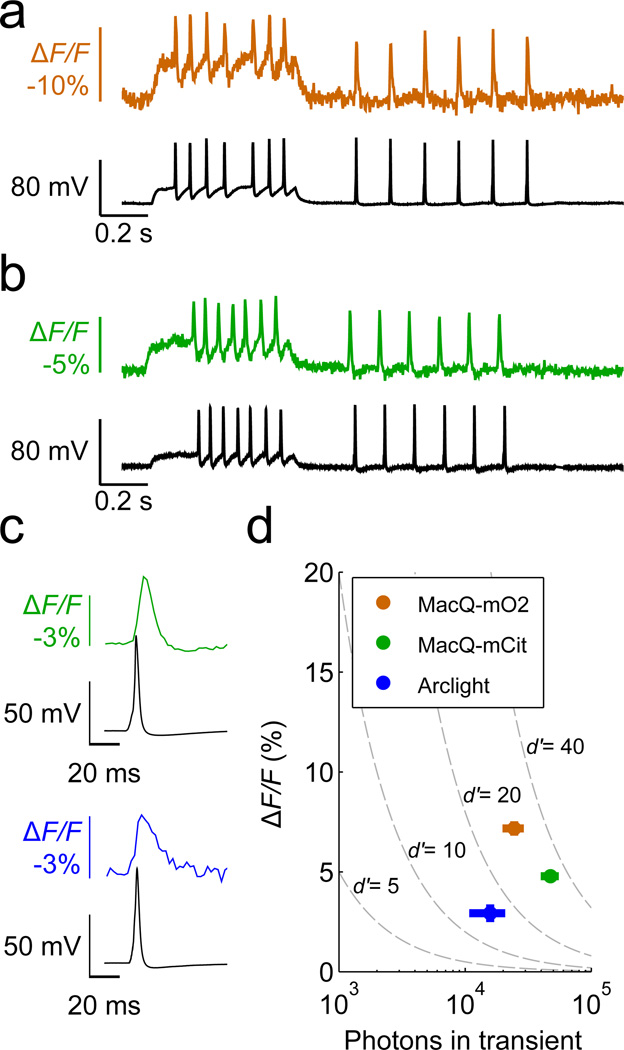
Figure 5. Mac voltage sensors report single action potentials with higher spike detectability than Arclight.
(a,b) Optical traces from cultured neurons expressing (a) MacQ-mOrange2 (orange trace) and (b) MacQ-mCitrine (green trace) had sharp peaks that matched the action potentials in the simultaneously acquired electrophysiological traces (black).
(c) Optical waveforms of single action potentials from MacQ-mCitrine (green trace, averaged over n = 16 spikes) and Arclight (blue trace, average over n = 10 spikes). The MacQ sensor has faster decay kinetics and reports the after-hyperpolarization phase of the spike waveform.
(d) Peak ΔF/F values of the optical responses to action potentials, plotted as a function of the total number of photons detected per spike. We estimated ordinate and abscissa values from the optical waveforms in panel c. Dashed lines are iso-contours of the spike detection fidelity, d’, which is determined by the sensor’s brightness, peak ΔF/F and optical waveform29.
Fluorescence imaging rates were 440 Hz for all panels, and the illumination intensity was 15 mW mm−2 at the specimen plane for all sensors. Error bars are s.e.m.

