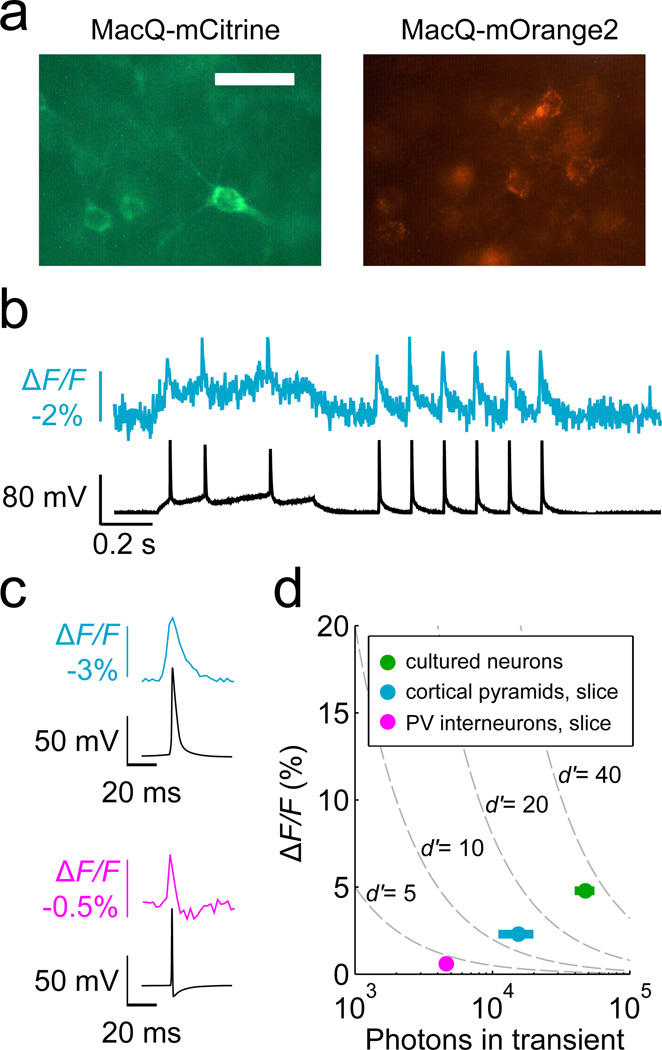
Figure 6. MacQ-mCitrine reports spikes from excitatory neurons in brain slices.
(a) Fluorescence images of neocortical neurons in fixed brain tissue from mice electroporated in utero with Mac sensors. Neurons electroporated with MacQ-mCitrine (left) exhibited minimal protein aggregation, whereas neurons electroporated with MacQ-mOrange2 (right) showed substantial aggregation. Scale bar is 20 µm.
(b) In a brain slice recording following in utero electroporation, MacQ-mCitrine fluorescence (cyan trace) from a layer 2/3 cortical pyramidal neuron matches the cell’s simultaneously recorded electrophysiological trace (black).
(c) Optical waveforms for single action potentials from MacQ-mCitrine targeted to layer 2/3 neocortical pyramidal neurons (top, averaged over n = 10 spikes) or from hippocampal parvalbumin interneurons (bottom, averaged over n = 60 spikes) correspond well to the simultaneously recorded electrophysiological waveforms.
(d) Peak ΔF/F values of the optical responses to action potentials, as a function of the total number of photons detected per spike. We measured the values of peak ΔF/F in live neocortex slices with MacQ-mCitrine in pyramidal neurons or parvalbumin (PV) interneurons, and estimated the abscissa values from the optical waveforms of panel c. The datum from studies in cultured neurons is shown for reference. Dashed lines are iso-contours of spike detection fidelity, d’.
Fluorescence imaging rates were 440 Hz for all panels; illumination intensity was 30 mW mm−2 for all sensors. Error bars are s.e.m.

