Figure 1.
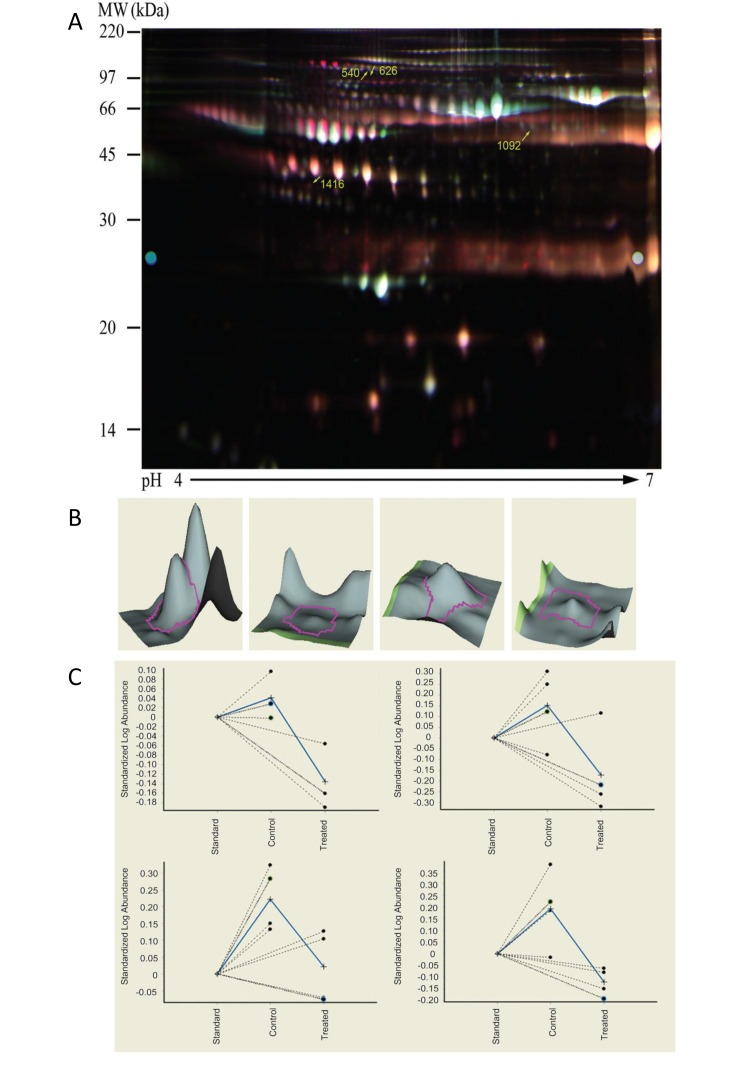
Proteomic profiling of ONFH sera revealed by 2-D DIGE analysis. Proteins extracted from the sera of the SONFH and control groups were differentially labeled with Cy3 and Cy5, respectively. An internal standard containing proteins from a mixture of sera from the two groups was labeled with Cy2 and loaded in all the gels. immobilized pH gradient strips (pH 4–7) were used for isoelectric focusing prior to standard SDS-PAGE (12.5% polyacrylamide). (A) Representative 2-D DIGE overlay image, with control in green and ONFH in red. Spots marked with a number indicate proteins whose abundance was significantly different between ONFH and control, within a 95% confidence level. (B) 3-D views of four spots that exhibit lower abundance in patients with SONFH. (C) The expression levels of the four proteins shown on 2-D DIGE were calculated with the DeCyder analysis software and presented as standardized log abundance. ONFH, osteonecrosis of the femoral head; SONFH, steroid-induced ONFH; Cy, cyanine; 2-D DIGE, two-dimensional difference gel electrophoresis; mw, molecular weight.

