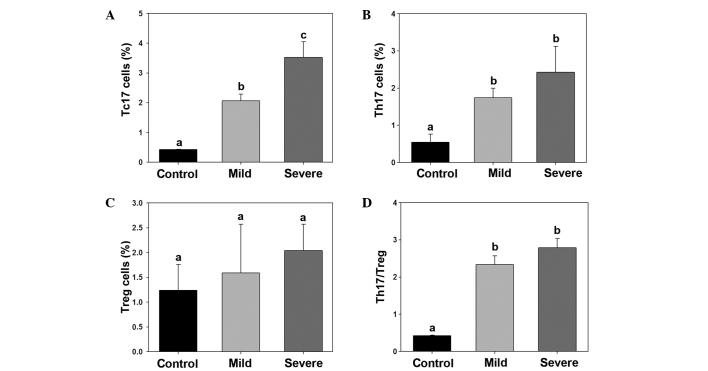
Figure 3.
Percentages of (A) Tc17, (B) Th17 and (C) Treg cells, as well as (D) the Th17/Treg ratio, are shown for the control, mild ankylosing spondylitis and severe ankylosing spondylitis groups. Different letters indicate a significant difference among the groups (P<0.05). Tc, T cytotoxic; Th, T helper; Treg, regulatory T.

