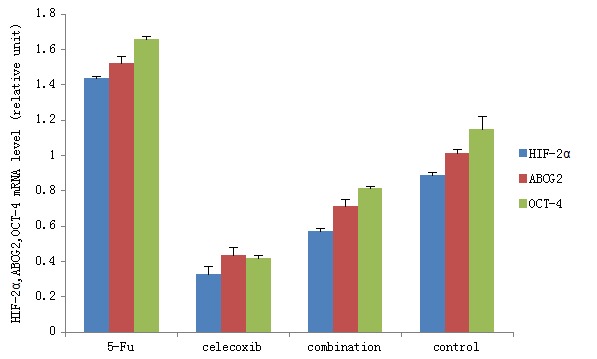
Figure 6.

HIF-2α, ABCG2 and Oct-4 mRNA expression levels in tumor tissues of each group detected by reverse transcription polymerase chain reaction. HIF-2α, hypoxia-inducible factor-2α; Oct-4, octamer-binding transcription factor 4. Pairwise comparison revealed significant differences between the expression levels of HIF-2α, ABCG2 and Oct-4 in the different groups (P<0.01).
